
Nomenclature
Short Name:
ACTR2B
Full Name:
Activin receptor type IIB
Alias:
- Activin A receptor, type IIB
- EC 2.7.11.30
- Kinase ACTR2B
- Activin receptor type IIB precursor
- ActR-IIB
- ACVR2B
- AVR2B
Classification
Type:
Protein-serine/threonine kinase
Group:
TKL
Family:
STKR
SubFamily:
Type2

Specific Links
Structure
Mol. Mass (Da):
57724
# Amino Acids:
512
# mRNA Isoforms:
1
mRNA Isoforms:
57,724 Da (512 AA; Q13705)
4D Structure:
NA
1D Structure:
3D Image (rendered using PV Viewer):
PDB ID
Subfamily Alignment
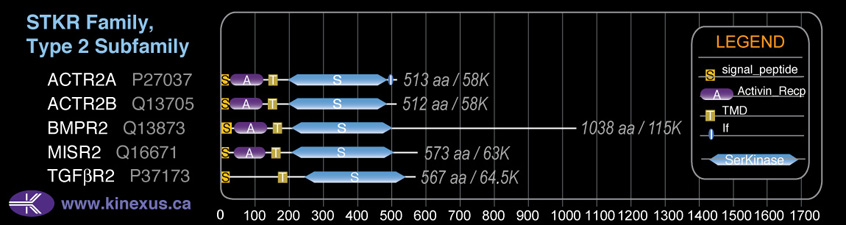
Domain Distribution:
| Start | End | Domain |
|---|---|---|
| 1 | 22 | signal_peptide |
| 25 | 117 | Activin_recp |
| 138 | 160 | TMD |
| 190 | 481 | Pkinase |
Post-translation Modifications
For detailed information on phosphorylation of this kinase go to PhosphoNET
N-GlcNAcylated:
N42, N65.
Serine phosphorylated:
S19, S490.
Threonine phosphorylated:
T488+.
Tyrosine phosphorylated:
Y364-.
Distribution
Based on gene microarray analysis from the NCBI
Human Tissue Distribution
% Max Expression:
Mean Expression:
Number of Samples:
Standard Deviation:
% Max Expression:
Mean Expression:
Number of Samples:
Standard Deviation:
 53
53
905
34
1003
 6
6
99
10
55
 2
2
41
11
43
 21
21
352
105
851
 41
41
686
31
512
 6
6
97
63
215
 11
11
188
39
461
 100
100
1693
34
3342
 14
14
240
10
174
 8
8
131
79
111
 6
6
97
25
102
 30
30
509
139
603
 4
4
64
22
38
 7
7
112
6
58
 6
6
106
21
128
 2
2
39
17
35
 35
35
600
179
4067
 3
3
57
16
60
 8
8
129
71
78
 31
31
528
107
432
 20
20
331
21
970
 4
4
76
24
95
 2
2
35
20
47
 5
5
77
17
70
 10
10
172
22
356
 59
59
1002
72
1814
 3
3
54
25
30
 5
5
78
17
61
 4
4
69
17
54
 11
11
185
28
126
 35
35
585
18
402
 18
18
308
31
448
 35
35
596
109
1066
 42
42
709
83
665
 6
6
96
48
135
Evolution
Species Conservation
PhosphoNET % Identity:
PhosphoNET % Similarity:
Homologene %
Identity:
PhosphoNET % Identity:
PhosphoNET % Similarity:
Homologene %
Identity:
 100
100
100
100 98.1
98.1
98.6
100 96
96
96
99 -
-
-
98 -
-
-
- 97.1
97.1
97.7
97 -
-
-
- 95
95
95
95 98.8
98.8
99
99 -
-
-
- 41.6
41.6
54.7
- 89.5
89.5
95.7
89 82.8
82.8
92.8
85 79.3
79.3
90
81 -
-
-
- -
-
-
- 51.4
51.4
68.4
- 25.8
25.8
39.5
- 49.7
49.7
64
- -
-
-
- -
-
-
- -
-
-
- -
-
-
- -
-
-
- -
-
-
-
For a wider analysis go to PhosphoNET Evolution in PhosphoNET
Binding Proteins
Examples of known interacting proteins
hiddentext
| No. | Name – UniProt ID |
|---|---|
| 1 | INHBA - P08476 |
| 2 | ACVR1B - P36896 |
| 3 | SYNJ2BP - P57105 |
| 4 | GDF11 - O95390 |
| 5 | MSTN - O14793 |
| 6 | BMP6 - P22004 |
| 7 | INHBB - P09529 |
| 8 | INHBC - P55103 |
| 9 | TGFBRAP1 - Q8WUH2 |
Regulation
Activation:
Activated by binding activin.
Inhibition:
NA
Synthesis:
NA
Degradation:
NA
Protein Kinase Specificity
Matrix of observed frequency (%) of amino acids in aligned protein substrate phosphosites
Matrix Type:
Predicted from the application of the Kinexus Kinase Substrate Predictor Version 2.0 algorithm, which was trained with over 10,000 kinase-protein substrate pairs and 8,000 kinase-peptide substrate pairs.
Domain #:
1
Inhibitors
For further details on these inhibitors click on the Compound Name and enter it into DrugKiNET or click on the ID's
Based on in vitro and/or in vivo phosphorylation data
| Compound Name | KD, Ki or IC50 (nM) | PubChem ID | ChEMBL ID | PubMed ID |
|---|
Disease Linkage
General Disease Association:
Congenital organ distribution malformation
Specific Diseases (Non-cancerous):
Heterotaxy; Heterotaxy, Visceral, 4 Autosomal; Visceral Heterotaxy; Acvr2b-related Visceral Heterotxy; Left-Right Axis Malformations; Dextrocardia
Comments:
A set of rare congenital defects in which the major visceral organs are distributed abnormally within the chest and abdomen.
Gene Expression in Cancers:
TranscriptoNET (www.transcriptonet.ca) analysis with mRNA expression data retrieved from the National Center for Biotechnology Information's Gene Expression Omnibus (GEO) database, which was normalized against 60 abundantly and commonly found proteins, indicated altered expression for this protein kinase as shown here as the percent change from normal tissue controls (%CFC) as supported with the Student T-test in the following types of human cancers: Clear cell renal cell carcinomas (cRCC) stage I (%CFC= +104, p<0.066); Prostate cancer - primary (%CFC= +114, p<0.0001); T-cell prolymphocytic leukemia (%CFC= +158, p<0.035); and Uterine leiomyomas from fibroids (%CFC= +66, p<0.063). The COSMIC website notes an up-regulated expression score for ACTR2B in diverse human cancers of 438, which is close to the average score of 462 for the human protein kinases. The down-regulated expression score of 10 for this protein kinase in human cancers was 0.2-fold of the average score of 60 for the human protein kinases.
Mutagenesis Experiments:
Insertional mutagenesis studies in mice have not yet revealed a role for this protein kinase in mouse cancer oncogenesis.
Mutation Rate in All Cancers:
Percent mutation rates per 100 amino acids length in human cancers: 0.07 % in 25335 diverse cancer specimens. This rate is only -11 % lower than the average rate of 0.075 % calculated for human protein kinases in general.
Mutation Rate in Specific Cancers:
Highest percent mutation rates per 100 amino acids length in human cancers: 0.5 % in 589 stomach cancers tested; 0.38 % in 1270 large intestine cancers tested; 0.19 % in 603 endometrium cancers tested.
Frequency of Mutated Sites:
None >2 in 20252 cancer specimens
Comments:
Only 1 deletion mutation at the C-terminal end of the protein are listed on the COSMIC website.