
Nomenclature
Short Name:
ADCK3
Full Name:
AarF domain containing kinase 3
Alias:
- CABC1
- Chaperone-activity of bc1 complex-like, mitochondrial [Precursor]
- Chaperone-ABC1-like
- LOC56997
Classification
Type:
Protein-serine/threonine kinase
Group:
Atypical
Family:
ABC1
SubFamily:
ABC1-A

Structure
Mol. Mass (Da):
71,950
# Amino Acids:
647
# mRNA Isoforms:
4
mRNA Isoforms:
71,950 Da (647 AA; Q8NI60); 66,627 Da (595 AA; Q8NI60-3); 42,537 Da (368 AA; Q8NI60-4); 18,937 Da (163 AA; Q8NI60-2)
4D Structure:
NA
1D Structure:
3D Image (rendered using PV Viewer):
PDB ID
Subfamily Alignment
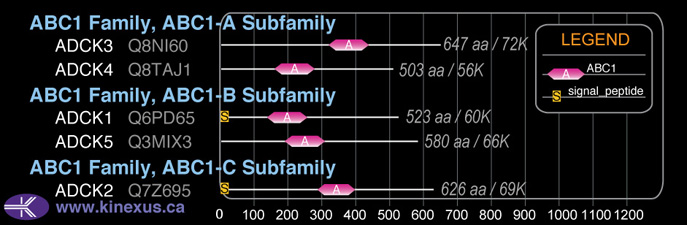
Domain Distribution:
Post-translation Modifications
For detailed information on phosphorylation of this kinase go to PhosphoNET
Serine phosphorylated:
S236, S239.
Tyrosine phosphorylated:
Y408.
Ubiquitinated:
K246, K295, K310, K314, K327, K642.
Distribution
Based on gene microarray analysis from the NCBI
Human Tissue Distribution
% Max Expression:
Mean Expression:
Number of Samples:
Standard Deviation:
% Max Expression:
Mean Expression:
Number of Samples:
Standard Deviation:
 58
58
1438
22
1183
 15
15
379
9
151
 9
9
212
11
139
 11
11
274
83
482
 29
29
713
21
586
 4
4
107
52
151
 4
4
88
25
79
 49
49
1208
35
1740
 23
23
571
10
471
 6
6
143
69
169
 12
12
290
24
191
 33
33
818
81
663
 5
5
114
22
61
 5
5
129
6
67
 19
19
479
21
553
 17
17
411
12
438
 19
19
481
170
1874
 12
12
307
16
370
 100
100
2486
79
1607
 27
27
675
84
621
 6
6
144
20
168
 7
7
174
22
178
 11
11
265
12
199
 4
4
107
16
91
 7
7
165
20
212
 52
52
1282
55
2018
 8
8
211
25
162
 8
8
189
16
258
 6
6
152
16
77
 3
3
63
28
75
 50
50
1255
18
806
 32
32
792
26
786
 3
3
65
55
102
 35
35
875
52
806
 5
5
116
35
116
Evolution
Species Conservation
PhosphoNET % Identity:
PhosphoNET % Similarity:
Homologene %
Identity:
PhosphoNET % Identity:
PhosphoNET % Similarity:
Homologene %
Identity:
 100
100
100
100 99.1
99.1
99.1
99 97.8
97.8
98.6
98 -
-
-
87.5 -
-
-
- 77.3
77.3
81
81 -
-
-
- 86.9
86.9
91.5
86 87.2
87.2
91.8
88 -
-
-
- 79.8
79.8
84.8
- -
-
-
76 -
-
-
70 65.5
65.5
75.3
71 -
-
-
- -
-
-
51 37.9
37.9
53
- 38.4
38.4
53.9
53 47.1
47.1
62.8
- -
-
-
- -
-
-
- -
-
-
47 -
-
-
47 33.9
33.9
49.1
42 -
-
-
50
For a wider analysis go to PhosphoNET Evolution in PhosphoNET
Binding Proteins
Examples of known interacting proteins
hiddentext
| No. | Name – UniProt ID |
|---|---|
| 1 | RABAC1 - Q9UI14 |
Regulation
Activation:
NA
Inhibition:
NA
Synthesis:
By p53.
Degradation:
NA
Protein Kinase Specificity
Matrix of observed frequency (%) of amino acids in aligned protein substrate phosphosites
Matrix Type:
Predicted from the application of the Kinexus Kinase Substrate Predictor Version 2.0 algorithm, which was trained with over 10,000 kinase-protein substrate pairs and 8,000 kinase-peptide substrate pairs.
Domain #:
1
Inhibitors
For further details on these inhibitors click on the Compound Name and enter it into DrugKiNET or click on the ID's
Based on in vitro and/or in vivo phosphorylation data
| Compound Name | KD, Ki or IC50 (nM) | PubChem ID | ChEMBL ID | PubMed ID |
|---|
| TG100115 | Kd = 94 nM | 10427712 | 230011 | 22037378 |
| Dasatinib | Kd = 190 nM | 11153014 | 1421 | 22037378 |
| PD173955 | Kd = 910 nM | 447077 | 386051 | 22037378 |
| WZ3146 | Kd > 1 µM | 44607360 | 20033049 | |
| WZ4002 | Kd > 1 µM | 44607530 | 20033049 | |
| R406 | Kd = 1.1 µM | 11984591 | 22037378 | |
| JNJ-7706621 | Kd = 1.2 µM | 5330790 | 191003 | 18183025 |
| SureCN7018367 | Kd < 1.25 µM | 18792927 | 450519 | 19035792 |
| Canertinib | Kd = 1.5 µM | 156414 | 31965 | 18183025 |
| NVP-TAE684 | Kd = 1.7 µM | 16038120 | 509032 | 22037378 |
| Erlotinib | Kd = 1.9 µM | 176870 | 553 | 18183025 |
| BMS-690514 | Kd > 2 µM | 11349170 | 21531814 | |
| Vandetanib | Kd = 4.5 µM | 3081361 | 24828 | 22037378 |
Disease Linkage
General Disease Association:
Coenzyme Q deficiency
Specific Diseases (Non-cancerous):
Coenzyme Q deficiency-4; Sporadic Ataxia; Spinocerebellar Ataxia, Autosomal Recessive, 9; Cabc1-related Coenzyme Q10 Deficiency
Comments:
E551K, R213W, G272V, G272D, Y514C and G549S mutations were identified in different COQ10D4 patients with worsening symptoms from early age, including cerebellar ataxia and seizures. Furthermore, deletions and insertions within the ADCK3 gene point towards a loss of function association with the disease.
Mutagenesis Experiments:
Insertional mutagenesis studies in mice have not yet revealed a role for this protein kinase in mouse cancer oncogenesis.
Mutation Rate in All Cancers:
Percent mutation rates per 100 amino acids length in human cancers: 0.04 % in 24737 diverse cancer specimens. This rate is -50 % lower than the average rate of 0.075 % calculated for human protein kinases in general. Such a low frequency of mutation in human cancers is consistent with this protein kinase playing a role as a tumour requiring protein (TRP).
Mutation Rate in Specific Cancers:
Highest percent mutation rates per 100 amino acids length in human cancers: 0.18 % in 1270 large intestine cancers tested.
Frequency of Mutated Sites:
None >2 in 19643 cancer specimens
Comments:
No deletions, insertions or complex mutations are noted on the COSMIC website.