
Nomenclature
Short Name:
ALK2
Full Name:
Activin receptor type I
Alias:
- ACVR1
- SKR1
- TSR-I
- ACVR1
- ACVRLK2
- ACVRLK2
- ALK-2
- EC 2.7.11.30
- Serine,threonine-protein kinase receptor R1
Classification
Type:
Protein-serine/threonine kinase
Group:
TKL
Family:
STKR
SubFamily:
Type1

Specific Links
Structure
Mol. Mass (Da):
57,153
# Amino Acids:
509
# mRNA Isoforms:
1
mRNA Isoforms:
57,153 Da (509 AA; Q04771)
4D Structure:
Interacts with FKBP1A.
1D Structure:
3D Image (rendered using PV Viewer):
PDB ID
Subfamily Alignment
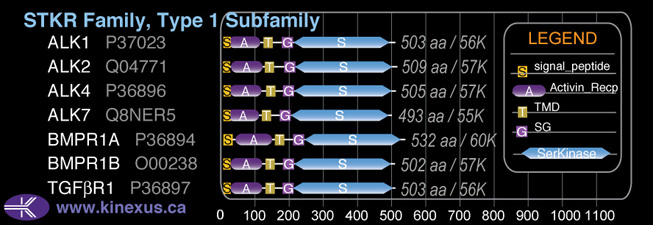
Domain Distribution:
| Start | End | Domain |
|---|---|---|
| 1 | 21 | signal_peptide |
| 20 | 107 | Activin_recp |
| 124 | 146 | TMD |
| 178 | 207 | GS |
| 208 | 502 | Pkinase |
Post-translation Modifications
For detailed information on phosphorylation of this kinase go to PhosphoNET
N-GlcNAcylated:
N102.
Serine phosphorylated:
S226, S501.
Threonine phosphorylated:
T203, T494, T496.
Distribution
Based on gene microarray analysis from the NCBI
Human Tissue Distribution
% Max Expression:
Mean Expression:
Number of Samples:
Standard Deviation:
% Max Expression:
Mean Expression:
Number of Samples:
Standard Deviation:
 56
56
826
16
836
 5
5
79
10
31
 24
24
362
9
389
 43
43
632
57
1000
 66
66
987
14
810
 10
10
144
43
121
 22
22
329
19
491
 24
24
362
30
496
 39
39
586
10
532
 14
14
203
53
228
 11
11
163
22
180
 46
46
679
103
684
 11
11
157
20
176
 9
9
131
9
69
 7
7
104
19
136
 10
10
146
8
46
 56
56
827
110
4788
 18
18
271
16
445
 14
14
206
51
173
 53
53
793
56
744
 11
11
169
18
194
 9
9
129
20
154
 9
9
133
18
190
 6
6
87
16
93
 6
6
94
18
93
 53
53
794
40
794
 10
10
147
23
243
 19
19
278
16
299
 25
25
375
16
462
 7
7
107
14
42
 84
84
1246
18
786
 100
100
1487
21
2873
 15
15
226
45
440
 69
69
1030
31
824
 6
6
90
22
48
Evolution
Species Conservation
PhosphoNET % Identity:
PhosphoNET % Similarity:
Homologene %
Identity:
PhosphoNET % Identity:
PhosphoNET % Similarity:
Homologene %
Identity:
 100
100
100
100 99.8
99.8
100
100 99.8
99.8
100
100 -
-
-
99 -
-
-
- 99.2
99.2
99.6
99 -
-
-
- 98.4
98.4
99.4
98 97.3
97.3
99
97 -
-
-
- 87.5
87.5
94.1
- 83.5
83.5
91
86 33.7
33.7
52.8
82 66.2
66.2
77.2
70 -
-
-
- 50.2
50.2
62.8
57 -
-
-
- 31
31
46.5
- 54.7
54.7
67.6
- -
-
-
- -
-
-
- -
-
-
- -
-
-
- -
-
-
- -
-
-
-
For a wider analysis go to PhosphoNET Evolution in PhosphoNET
Binding Proteins
Examples of known interacting proteins
hiddentext
| No. | Name – UniProt ID |
|---|---|
| 1 | SMAD1 - Q15797 |
| 2 | SMAD5 - Q99717 |
| 3 | BMP7 - P18075 |
| 4 | FNTA - P49354 |
| 5 | BMP2 - P12643 |
| 6 | ACVR1B - P36896 |
| 7 | ACVR2A - P27037 |
| 8 | INHBC - P55103 |
| 9 | GDF5 - P43026 |
| 10 | SMAD9 - O15198 |
| 11 | ENG - P17813 |
| 12 | BMPR2 - Q13873 |
| 13 | IGSF1 - Q8N6C5 |
| 14 | INHBA - P08476 |
| 15 | INHBB - P09529 |
Regulation
Activation:
Activated by binding activin.
Inhibition:
NA
Synthesis:
NA
Degradation:
NA
Protein Kinase Specificity
Matrix of observed frequency (%) of amino acids in aligned protein substrate phosphosites
Matrix Type:
Predicted from the application of the Kinexus Kinase Substrate Predictor Version 2.0 algorithm, which was trained with over 10,000 kinase-protein substrate pairs and 8,000 kinase-peptide substrate pairs.
Domain #:
1
Inhibitors
For further details on these inhibitors click on the Compound Name and enter it into DrugKiNET or click on the ID's
Based on in vitro and/or in vivo phosphorylation data
| Compound Name | KD, Ki or IC50 (nM) | PubChem ID | ChEMBL ID | PubMed ID |
|---|
Disease Linkage
General Disease Association:
Cancer, connective tissue disorders
Specific Diseases (Non-cancerous):
Fibrodysplasia ossificans progressiva (FOP)
Specific Cancer Types:
Osteochondromas
Comments:
ALK2 appears to be an oncoprotein (OP). Mutations in the ALK2 gene have been associated with several human cancer types, in particular gliomas. For example, activating mutations in the ALK2 gene have been reported in 21% of patients with diffuse intrinsic pontine glioma (DIPG), which are malignant glial neoplasms of the ventral pons that are highly invasive and associated with a poor patient survival (9-12 months). The mutations observed in these cancer specimens include the A206H, A258G, G328E, G328V, G328Y, and G356D substitution mutations, which are not described for other cancers. Identical mutations are found in the germ-line tissue of patients with fibrodysplasia ossificans progressiva (FOP) and have been shown to result in the constitutive activation of BMP-TGF-beta signalling in the cells, indicating that the mutations associated with cancer may represent a gain-of-function mutations of the ALK2 protein. Therefore, aberrant activity of the ALK2 protein is implicated in tumorigenesis and the development of cancer.
Gene Expression in Cancers:
TranscriptoNET (www.transcriptonet.ca) analysis with mRNA expression data retrieved from the National Center for Biotechnology Information's Gene Expression Omnibus (GEO) database, which was normalized against 60 abundantly and commonly found proteins, indicated altered expression for this protein kinase as shown here as the percent change from normal tissue controls (%CFC) as supported with the Student T-test in the following types of human cancers: Bladder carcinomas (%CFC= +45, p<0.008); Brain oligodendrogliomas (%CFC= -89, p<0.05); Breast epithelial carcinomas (%CFC= -54, p<0.04); Cervical cancer stage 2A (%CFC= +97, p<0.048); Classical Hodgkin lymphomas (%CFC= +79, p<0.002); Gastric cancer (%CFC= +88, p<0.003); Head and neck squamous cell carcinomas (HNSCC) (%CFC= +58, p<0.0005); Large B-cell lymphomas (%CFC= +55, p<(0.0003); Malignant pleural mesotheliomas (MPM) tumours (%CFC= +75, p<0.014); Oral squamous cell carcinomas (OSCC) (%CFC= +206, p<0.0001); Ovary adenocarcinomas (%CFC= -57, p<0.004); Papillary thyroid carcinomas (PTC) (%CFC= +52, p<0.013); Skin fibrosarcomas (%CFC= +51); and Uterine leiomyomas (%CFC= -64, p<0.033). The COSMIC website notes an up-regulated expression score for ALK2 in diverse human cancers of 375, which is 0.8-fold of the average score of 462 for the human protein kinases. The down-regulated expression score of 42 for this protein kinase in human cancers was 0.7-fold of the average score of 60 for the human protein kinases.
Mutagenesis Experiments:
Insertional mutagenesis studies in mice have not yet revealed a role for this protein kinase in mouse cancer oncogenesis.
Mutation Rate in All Cancers:
Percent mutation rates per 100 amino acids length in human cancers: 0.11 % in 25499 diverse cancer specimens. This rate is a modest 1.53-fold higher than the average rate of 0.075 % calculated for human protein kinases in general.
Mutation Rate in Specific Cancers:
Highest percent mutation rates per 100 amino acids length in human cancers: 0.39 % in 805 skin cancers tested; 0.36 % in 602 endometrium cancers tested; 0.36 % in 1093 large intestine cancers tested; 0.13 % in 1988 central nervous system cancers tested; 0.1 % in 1942 lung cancers tested.
Frequency of Mutated Sites:
Most frequent mutations with the number of reports indicated in brackets: G238V (14); G238E (11); R206H (12); R258G (6).
Comments:
Only 2 deletions, 1 insertion, and no complex mutations are noted on the COSMIC website.