
Nomenclature
Short Name:
AXL
Full Name:
AXL oncogene-encoded protein-tyrosine kinase UFO
Alias:
- Adhesion-related kinase
- JTK11
- Kinase AXL
- UFO
- ARK
- AXL oncogene
- AXL receptor tyrosine kinase
- EC 2.7.10.1
Classification
Type:
Protein-tyrosine kinase
Group:
TK
Family:
Axl
SubFamily:
NA

Specific Links
Structure
Mol. Mass (Da):
97377
# Amino Acids:
885
# mRNA Isoforms:
2
mRNA Isoforms:
98,336 Da (894 AA; P30530); 97,377 Da (885 AA; P30530-2)
4D Structure:
Heterodimer and heterotetramer with GAS6.
1D Structure:
3D Image (rendered using PV Viewer):
PDB ID
Subfamily Alignment
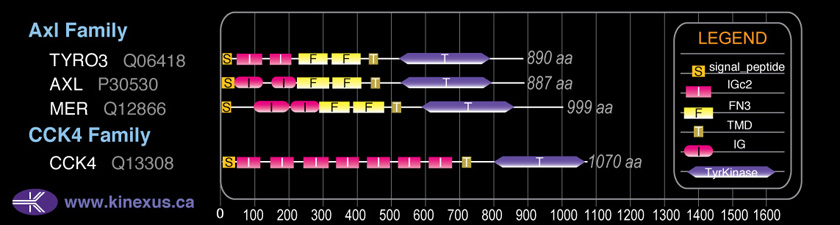
Domain Distribution:
| Start | End | Domain |
|---|---|---|
| 1 | 32 | signal_peptide |
| 27 | 128 | IG |
| 139 | 222 | IG - I-set |
| 225 | 332 | FN3 |
| 333 | 427 | FN3 |
| 443 | 465 | TMD |
| 529 | 796 | TyrKc |
| 536 | 805 | Pkinase |
Kinexus Products
Click on entries below for direct links to relevant products from Kinexus for this protein kinase.
hiddentext
Post-translation Modifications
For detailed information on phosphorylation of this kinase go to PhosphoNET
Acetylated:
R724.
N-GlcNAcylated:
N43, N157, N198, N339, N345, N401.
Serine phosphorylated:
S100, S201, S202, S204, S503, S612, S875, S884.
Threonine phosphorylated:
T200, T873.
Tyrosine phosphorylated:
Y481, Y634, Y643, Y698, Y702+, Y703, Y726, Y759, Y779, Y821+, Y866+.
Ubiquitinated:
K523, K540, K563, K666, K714.
Distribution
Based on gene microarray analysis from the NCBI
Human Tissue Distribution
% Max Expression:
Mean Expression:
Number of Samples:
Standard Deviation:
% Max Expression:
Mean Expression:
Number of Samples:
Standard Deviation:
 61
61
1004
29
1097
 10
10
165
17
111
 24
24
401
41
488
 19
19
308
129
443
 41
41
667
25
660
 8
8
133
81
234
 31
31
511
39
702
 38
38
617
79
1266
 29
29
473
17
349
 10
10
164
138
348
 10
10
170
67
520
 39
39
632
236
684
 12
12
204
63
461
 8
8
123
15
63
 11
11
185
55
497
 11
11
176
17
232
 10
10
164
320
952
 12
12
190
51
481
 6
6
97
128
131
 38
38
626
109
653
 12
12
193
58
255
 14
14
227
62
354
 13
13
209
51
387
 18
18
295
53
595
 18
18
292
59
945
 31
31
504
92
705
 24
24
386
66
1635
 36
36
595
52
2224
 20
20
332
52
401
 12
12
201
28
115
 18
18
291
24
291
 100
100
1638
36
3708
 9
9
142
72
460
 71
71
1158
57
916
 6
6
92
35
86
Evolution
Species Conservation
PhosphoNET % Identity:
PhosphoNET % Similarity:
Homologene %
Identity:
PhosphoNET % Identity:
PhosphoNET % Similarity:
Homologene %
Identity:
 100
100
100
100 32.2
32.2
45.1
99 69.6
69.6
71.1
- -
-
-
86 -
-
-
99 89.7
89.7
92.6
92 -
-
-
- 87.4
87.4
91.3
88 40.2
40.2
54.3
88 -
-
-
- 24.7
24.7
30.4
- 42
42
57.8
- 41.5
41.5
59.3
64 40.7
40.7
56.8
- -
-
-
- -
-
-
- -
-
-
- -
-
-
- -
-
-
- -
-
-
- -
-
-
- -
-
-
- -
-
-
- -
-
-
- -
-
-
-
For a wider analysis go to PhosphoNET Evolution in PhosphoNET
Binding Proteins
Examples of known interacting proteins
hiddentext
| No. | Name – UniProt ID |
|---|---|
| 1 | GAS6 - Q14393 |
| 2 | PIK3R2 - O00459 |
| 3 | PIK3R1 - P27986 |
| 4 | PTPN11 - Q06124 |
| 5 | IL15RA - Q13261 |
| 6 | ADAM10 - O14672 |
| 7 | CBL - P22681 |
| 8 | IL2RG - P31785 |
| 9 | LCK - P06239 |
| 10 | PLCG1 - P19174 |
| 11 | CSK - P41240 |
| 12 | SRC - P12931 |
| 13 | GRB2 - P62993 |
| 14 | SOCS1 - O15524 |
| 15 | RANBP9 - Q96S59 |
Regulation
Activation:
Phosphorylation of Tyr-821 induces interactions with Grb2, PIK3R1, PIK3R2, and PLCG1.
Inhibition:
NA
Synthesis:
NA
Degradation:
NA
Protein Kinase Specificity
Matrix of observed frequency (%) of amino acids in aligned protein substrate phosphosites
Matrix Type:
Predicted from the application of the Kinexus Kinase Substrate Predictor Version 2.0 algorithm, which was trained with over 10,000 kinase-protein substrate pairs and 8,000 kinase-peptide substrate pairs.
Domain #:
1
Inhibitors
For further details on these inhibitors click on the Compound Name and enter it into DrugKiNET or click on the ID's
Based on in vitro and/or in vivo phosphorylation data
| Compound Name | KD, Ki or IC50 (nM) | PubChem ID | ChEMBL ID | PubMed ID |
|---|
Disease Linkage
General Disease Association:
Cancer, ischemia
Specific Diseases (Non-cancerous):
Critical limb ischemia; Limb ischemia
Comments:
Critical limb ischemia and limb Ischemia are associated with atherosclerosis. The MIR16-1 (microRNA 16-1) gene and receptor-tyrosine kinases/adaptors have a role in ischemia. The associated tissues includes bone, bone marrow, and endothelium.
Specific Cancer Types:
Thyroid tumoursigenesis; Myeloproliferative disorders; Prostatic carcinomas cells; Breast cancer; Chronic myelogenous leukemias (CML)
Comments:
AXL is overexpressed in numerous human cancers, including thyroid carcinomas, myeloproliferative disorders, prostatic carcinoma cells, and breast cancer. Its up-regulation in expression contributes to metastasis and invasion, and in most cases negatively correlates with prognosis.
Gene Expression in Cancers:
TranscriptoNET (www.transcriptonet.ca) analysis with mRNA expression data retrieved from the National Center for Biotechnology Information's Gene Expression Omnibus (GEO) database, which was normalized against 60 abundantly and commonly found proteins, indicated altered expression for this protein kinase as shown here as the percent change from normal tissue controls (%CFC) as supported with the Student T-test in the following types of human cancers: Bladder carcinomas (%CFC= -47, p<0.015); Brain glioblastomas (%CFC= +294, p<0.047); Clear cell renal cell carcinomas (cRCC) (%CFC= +191, p<0.005); Colon mucosal cell adenomas (%CFC= -58, p<0.0001); Colorectal adenocarcinomas (early onset) (%CFC= +198, p<0.006); Uterine leiomyomas from fibroids (%CFC= -53, p<0.072); and Vulvar intraepithelial neoplasia (%CFC= -51, p<0.081). The COSMIC website notes an up-regulated expression score for AXL in diverse human cancers of 405, which is 0.9-fold of the average score of 462 for the human protein kinases. The down-regulated expression score of 0 for this protein kinase in human cancers was 100% lower than the average score of 60 for the human protein kinases.
Mutagenesis Experiments:
Insertional mutagenesis studies in mice have not yet revealed a role for this protein kinase in mouse cancer oncogenesis.
Mutation Rate in All Cancers:
Percent mutation rates per 100 amino acids length in human cancers: 0.1 % in 25530 diverse cancer specimens. This rate is only 37 % higher than the average rate of 0.075 % calculated for human protein kinases in general.
Mutation Rate in Specific Cancers:
Highest percent mutation rates per 100 amino acids length in human cancers: 0.67 % in 805 skin cancers tested; 0.46 % in 589 stomach cancers tested; 0.46 % in 1093 large intestine cancers tested; 0.33 % in 602 endometrium cancers tested; 0.1 % in 1941 lung cancers tested; 0.08 % in 1466 breast cancers tested.
Frequency of Mutated Sites:
None > 5 in 20,663 cancer specimens
Comments:
Eleven deletions (3 at H292), 6 insertions (all at H292) and no complex mutations are noted at the COSMIC website. Most of these mutations lead to truncated proteins that are missing the kinase catalytic domain.