
Nomenclature
Short Name:
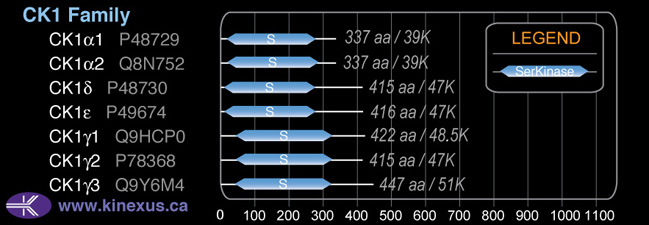
CK1a2
Full Name:
Casein kinase I, alpha-like isoform
Alias:
- CK1
- CK1-alpha2
- KC1AL
- CK1a
- CKI-alpha
- CSNK1A1L
- CSNK1A2
- EC 2.7.11.1
Classification
Type:
Protein-serine/threonine kinase
Group:
CK1
Family:
CK1
SubFamily:
NA

Structure
Mol. Mass (Da):
39086
# Amino Acids:
337
# mRNA Isoforms:
1
mRNA Isoforms:
39,086 Da (337 AA; Q8N752)
4D Structure:
NA
1D Structure:
Subfamily Alignment
Domain Distribution:
| Start | End | Domain |
|---|---|---|
| 17 | 277 | Pkinase |
Kinexus Products
Click on entries below for direct links to relevant products from Kinexus for this protein kinase.
hiddentext
Post-translation Modifications
For detailed information on phosphorylation of this kinase go to PhosphoNET
Acetylated:
K53, K62, K83.
Serine phosphorylated:
S206.
Threonine phosphorylated:
T146, T184, T228, T287.
Tyrosine phosphorylated:
Y59, Y209, Y213, Y292, Y294.
Ubiquitinated:
K130, K162, K302, .
Distribution
Based on gene microarray analysis from the NCBI
Human Tissue Distribution
% Max Expression:
Mean Expression:
Number of Samples:
Standard Deviation:
% Max Expression:
Mean Expression:
Number of Samples:
Standard Deviation:
 0
0
6
3
3
 2
2
249
3
15
 -
-
-
-
-
 1.5
1.5
226
3
18
 1.2
1.2
184
3
13

 1
1
158
3
16
 1.1
1.1
171
3
2
 2
2
229
3
6
 0.6
0.6
97
3
2
 1
1
146
3
8
 1.3
1.3
196
3
23
 -
-
-
-
-
 1.4
1.4
221
3
10
 0.6
0.6
86
3
3
 -
-
-
-
-
 2
2
330
3
9
 1
1
152
3
11
 1.1
1.1
163
3
13
 2
2
339
3
27
 1
1
148
3
14
 1.2
1.2
181
3
9
 -
-
-
-
-
 1.2
1.2
189
3
6
 1.3
1.3
204
3
9
 1
1
160
3
21
 2
2
275
3
17
 2
2
297
3
8
 2
2
240
3
8
 -
-
-
-
-
 5
5
779
12
61
 100
100
15252
6
8716
 -
-
-
-
-
 -
-
-
-
-
 0.1
0.1
18
9
31
Evolution
Species Conservation
PhosphoNET % Identity:
PhosphoNET % Similarity:
Homologene %
Identity:
PhosphoNET % Identity:
PhosphoNET % Similarity:
Homologene %
Identity:
 100
100
100
100 99.1
99.1
99.7
99 97.9
97.9
99.4
- -
-
-
- -
-
-
- 90.5
90.5
94.4
- -
-
-
- 54.6
54.6
66.1
- 88.1
88.1
91.1
- -
-
-
- -
-
-
- 90.5
90.5
94.7
- 54
54
66
- 56.6
56.6
68.2
- -
-
-
- 70.6
70.6
81.3
- 76.3
76.3
84
- 75.4
75.4
82.1
- 74.1
74.1
84.2
- -
-
-
- -
-
-
- -
-
-
69 48.7
48.7
61.8
65 39.9
39.9
52.8
- -
-
-
-
For a wider analysis go to PhosphoNET Evolution in PhosphoNET
Regulation
Activation:
NA
Inhibition:
NA
Synthesis:
NA
Degradation:
NA
Known Downstream Substrates
For further details on these substrates click on the Substrate Short Name or UniProt ID. Phosphosite Location is hyperlinked to PhosphoNET
predictions.
Based on in vitro and/or in vivo phosphorylation data
| Substrate Short Name | UniProt ID (Human) | Phosphosite Location | Phosphosite Sequence | Effect of Phosphorylation |
|---|
Protein Kinase Specificity
Matrix of observed frequency (%) of amino acids in aligned protein substrate phosphosites
Matrix Type:
Predicted from the application of the Kinexus Kinase Substrate Predictor Version 2.0 algorithm, which was trained with over 10,000 kinase-protein substrate pairs and 8,000 kinase-peptide substrate pairs.
Domain #:
1
Inhibitors
For further details on these inhibitors click on the Compound Name and enter it into DrugKiNET or click on the ID's
Based on in vitro and/or in vivo phosphorylation data
| Compound Name | KD, Ki or IC50 (nM) | PubChem ID | ChEMBL ID | PubMed ID |
|---|
| CHEMBL249097 | Kd < 150 nM | 25138012 | 249097 | 19035792 |
| SureCN7685369 | Kd = 225 nM | 9925594 | 526901 | 19035792 |
| Staurosporine | Kd = 250 nM | 5279 | 18183025 | |
| Sunitinib | Kd = 550 nM | 5329102 | 535 | 18183025 |
| BMS-690514 | Kd = 1 µM | 11349170 | 21531814 | |
| Pelitinib | Kd = 1 µM | 6445562 | 607707 | 18183025 |
| WZ3146 | Kd > 1 µM | 44607360 | 20033049 | |
| WZ4002 | Kd > 1 µM | 44607530 | 20033049 | |
| Lestaurtinib | Kd = 1.5 µM | 126565 | 18183025 | |
| SU14813 | Kd = 1.5 µM | 10138259 | 1721885 | 18183025 |
| SB203580 | Kd = 1.7 µM | 176155 | 10 | 18183025 |
| SB202190 | Kd = 1.9 µM | 5353940 | 278041 | 18183025 |
| PP242 | Kd = 2 µM | 25243800 | 22037378 | |
| Alvocidib | Kd = 2.4 µM | 9910986 | 428690 | 22037378 |
| LY364947 | Kd < 2.5 µM | 447966 | 261454 | 19035792 |
| Bosutinib | Kd = 2.6 µM | 5328940 | 288441 | 22037378 |
| A674563 | Kd = 4.6 µM | 11314340 | 379218 | 22037378 |
Disease Linkage
General Disease Association:
Sleep, and cardiovascular disorders
Specific Diseases (Non-cancerous):
Sleep disorder; Angina pectoris
Comments:
CK1a2 is associated with sleep disorder and angina pectoris.
Gene Expression in Cancers:
The COSMIC website notes an up-regulated expression score for CK1a2 in diverse human cancers of 333, which is 0.7-fold of the average score of 462 for the human protein kinases. The down-regulated expression score of 2 for this protein kinase in human cancers was 97% lower than the average score of 60 for the human protein kinases.
Mutagenesis Experiments:
Insertional mutagenesis studies in mice have not yet revealed a role for this protein kinase in mouse cancer oncogenesis.
Mutation Rate in All Cancers:
Percent mutation rates per 100 amino acids length in human cancers: 0.14 % in 24789 diverse cancer specimens. This rate is 1.9-fold higher than the average rate of 0.075 % calculated for human protein kinases in general.
Frequency of Mutated Sites:
Most frequent mutations with the number of reports indicated in brackets: R148H (4).
Comments:
Only 1 deletion and 2 insertions and no complex mutations are noted on the COSMIC website.