
Nomenclature
Short Name:
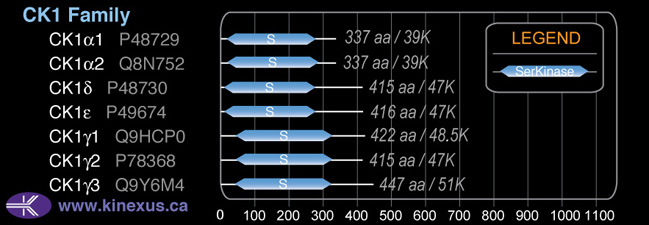
CK1g3
Full Name:
Casein kinase I, gamma 3 isoform
Alias:
- CK1-gamma3
- CSNK1G3
- EC 2.7.11.1
- KC13
- KC1G3
Classification
Type:
Protein-serine/threonine kinase
Group:
CK1
Family:
CK1
SubFamily:
NA

Specific Links
Structure
Mol. Mass (Da):
51,389
# Amino Acids:
447
# mRNA Isoforms:
6
mRNA Isoforms:
52,378 Da (455 AA; Q9Y6M4-2); 51,389 Da (447 AA; Q9Y6M4); 49,027 Da (424 AA; Q9Y6M4-4); 48,898 Da (423 AA; Q9Y6M4-3); 40,729 Da (348 AA; Q9Y6M4-5); 36,492 Da (311 AA; Q9Y6M4-6)
4D Structure:
Monomer
1D Structure:
3D Image (rendered using PV Viewer):
PDB ID
Subfamily Alignment
Domain Distribution:
| Start | End | Domain |
|---|---|---|
| 43 | 304 | Pkinase |
Post-translation Modifications
For detailed information on phosphorylation of this kinase go to PhosphoNET
Serine phosphorylated:
S11, S31, S32, S34, S344, S345, S392, S413.
Threonine phosphorylated:
T29, T65, T256, T399, T421.
Tyrosine phosphorylated:
Y64, Y68, Y87, Y90, Y160, Y261.
Ubiquitinated:
K253.
Distribution
Based on gene microarray analysis from the NCBI
Human Tissue Distribution
% Max Expression:
Mean Expression:
Number of Samples:
Standard Deviation:
% Max Expression:
Mean Expression:
Number of Samples:
Standard Deviation:
 29
29
1024
28
910
 0.8
0.8
27
10
23
 4
4
153
13
87
 9
9
299
123
489
 22
22
756
34
665
 3
3
118
63
157
 4
4
131
35
103
 37
37
1295
44
3065
 22
22
757
10
739
 3
3
97
91
82
 4
4
123
34
98
 20
20
686
108
653
 4
4
133
24
81
 1.2
1.2
43
6
41
 3
3
103
31
86
 1.4
1.4
47
17
34
 11
11
381
199
2792
 3
3
105
18
86
 2
2
74
85
49
 20
20
695
112
661
 3
3
109
30
98
 4
4
122
32
109
 6
6
193
14
108
 4
4
149
18
117
 3
3
89
30
79
 23
23
790
80
878
 3
3
112
27
83
 4
4
123
18
86
 5
5
168
18
134
 2
2
77
42
76
 22
22
765
30
535
 100
100
3473
31
6379
 4
4
154
78
421
 26
26
892
78
727
 9
9
309
48
512
Evolution
Species Conservation
PhosphoNET % Identity:
PhosphoNET % Similarity:
Homologene %
Identity:
PhosphoNET % Identity:
PhosphoNET % Similarity:
Homologene %
Identity:
 100
100
100
100 80.4
80.4
88.8
100 99.8
99.8
99.8
100 -
-
-
99 -
-
-
- 99.3
99.3
99.8
100 -
-
-
- 85.7
85.7
88.6
99 98.9
98.9
99.5
99 -
-
-
- -
-
-
- 79.6
79.6
88.2
- 77
77
86.1
97 77.6
77.6
83.9
82 -
-
-
- 41.4
41.4
58.8
71 -
-
-
- -
-
-
- -
-
-
- -
-
-
- -
-
-
- -
-
-
- 46
46
62.7
- 38.8
38.8
53.3
49 -
-
-
64
For a wider analysis go to PhosphoNET Evolution in PhosphoNET
Binding Proteins
Examples of known interacting proteins
hiddentext
| No. | Name – UniProt ID |
|---|---|
| 1 | PPP1R14A - Q96A00 |
| 2 | CSNK1G2 - P78368 |
| 3 | CSNK1G1 - Q9HCP0 |
| 4 | CSNK1D - P48730 |
Regulation
Activation:
NA
Inhibition:
NA
Synthesis:
NA
Degradation:
NA
Protein Kinase Specificity
Matrix of observed frequency (%) of amino acids in aligned protein substrate phosphosites
Matrix Type:
Predicted from the application of the Kinexus Kinase Substrate Predictor Version 2.0 algorithm, which was trained with over 10,000 kinase-protein substrate pairs and 8,000 kinase-peptide substrate pairs.
Domain #:
1
Inhibitors
For further details on these inhibitors click on the Compound Name and enter it into DrugKiNET or click on the ID's
Based on in vitro and/or in vivo phosphorylation data
| Compound Name | KD, Ki or IC50 (nM) | PubChem ID | ChEMBL ID | PubMed ID |
|---|
Disease Linkage
General Disease Association:
Cancer
Specific Cancer Types:
Non-small cell lung cancer (NSCLC); Anaplastic large cell lymphomas (ALCL); Gastric carcinomas
Gene Expression in Cancers:
TranscriptoNET (www.transcriptonet.ca) analysis with mRNA expression data retrieved from the National Center for Biotechnology Information's Gene Expression Omnibus (GEO) database, which was normalized against 60 abundantly and commonly found proteins, indicated altered expression for this protein kinase as shown here as the percent change from normal tissue controls (%CFC) as supported with the Student T-test in the following types of human cancers: Bladder carcinomas (%CFC= +90, p<0.0001); Pituitary adenomas (ACTH-secreting) (%CFC= +51); Skin fibrosarcomas (%CFC= +57); and Skin squamous cell carcinomas (%CFC= +48, p<0.022). The COSMIC website notes an up-regulated expression score for CK1g3 in diverse human cancers of 362, which is 0.8-fold of the average score of 462 for the human protein kinases. The down-regulated expression score of 258 for this protein kinase in human cancers was 4.3-fold of the average score of 60 for the human protein kinases.
Mutagenesis Experiments:
Insertional mutagenesis studies in mice support a role for this protein kinase in mouse cancer oncogenesis.
Mutation Rate in All Cancers:
Percent mutation rates per 100 amino acids length in human cancers: 0.07 % in 24752 diverse cancer specimens. This rate is only -5 % lower and is very similar to the average rate of 0.075 % calculated for human protein kinases in general.
Mutation Rate in Specific Cancers:
Highest percent mutation rates per 100 amino acids length in human cancers: 0.37 % in 1270 large intestine cancers tested; 0.3 % in 603 endometrium cancers tested; 0.27 % in 589 stomach cancers tested.
Frequency of Mutated Sites:
None > 3 in 20,035 cancer specimens
Comments:
Only 4 deletions, 3 insertions, and no complex mutations are noted on the COSMIC website.