
Nomenclature
Short Name:
CLIK1
Full Name:
Serine-threonine-protein kinase 35
Alias:
- CLP-36 interacting kinase
- BA550O8.2
- PDLIM1-interacting kinase 1
- Serine/threonine kinase 35
- STK35
- Clik1
- CLP-36 interacting kinase
- CLP-36-interacting kinase
- EC 2.7.11.1
Classification
Type:
Protein-serine/threonine kinase
Group:
Other
Family:
NKF4
SubFamily:
NA

Specific Links
Structure
Mol. Mass (Da):
58051
# Amino Acids:
534
# mRNA Isoforms:
1
mRNA Isoforms:
58,051 Da (534 AA; Q8TDR2)
4D Structure:
Interacts with PDLIM1/CLP-36.
1D Structure:
Subfamily Alignment

Domain Distribution:
| Start | End | Domain |
|---|---|---|
| 202 | 529 | Pkinase |
Post-translation Modifications
For detailed information on phosphorylation of this kinase go to PhosphoNET
Serine phosphorylated:
S6, S34, S203, S212, S413, S414, S418, S456, S499.
Threonine phosphorylated:
T458, T465, T496.
Tyrosine phosphorylated:
Y202, Y213, Y217.
Ubiquitinated:
K503.
Distribution
Based on gene microarray analysis from the NCBI
Human Tissue Distribution
% Max Expression:
Mean Expression:
Number of Samples:
Standard Deviation:
% Max Expression:
Mean Expression:
Number of Samples:
Standard Deviation:
 71
71
1370
36
1219
 26
26
509
12
822
 -
-
-
-
-
 10
10
185
132
329
 42
42
819
46
596
 5
5
96
45
155
 9
9
165
57
285
 60
60
1161
16
2329
 0.4
0.4
8
3
2
 10
10
195
95
369
 22
22
424
13
756
 36
36
702
62
692
 21
21
410
4
250
 50
50
966
7
1074
 16
16
316
13
438
 5
5
100
29
139
 25
25
493
117
3815
 26
26
496
7
620
 10
10
187
67
431
 39
39
753
137
647
 8
8
155
13
221
 2
2
31
9
46
 -
-
-
-
-
 100
100
1934
11
1902
 8
8
146
13
196
 51
51
982
91
964
 13
13
255
7
307
 28
28
532
7
669
 18
18
351
7
381
 8
8
146
42
179
 91
91
1751
12
23
 6
6
109
35
87
 20
20
379
97
650
 46
46
880
130
742
 24
24
470
74
447
Evolution
Species Conservation
PhosphoNET % Identity:
PhosphoNET % Similarity:
Homologene %
Identity:
PhosphoNET % Identity:
PhosphoNET % Similarity:
Homologene %
Identity:
 100
100
100
100 74.9
74.9
75
99 74.7
74.7
75
97 -
-
-
98.5 -
-
-
- 83.3
83.3
84.8
91 -
-
-
- 87.3
87.3
90.5
88 -
-
-
88 -
-
-
- 49.4
49.4
63.1
- -
-
-
87 41.7
41.7
51.3
91 43
43
53.1
80 -
-
-
- -
-
-
- -
-
-
- -
-
-
- -
-
-
- -
-
-
- -
-
-
- -
-
-
- -
-
-
- -
-
-
- -
-
-
-
For a wider analysis go to PhosphoNET Evolution in PhosphoNET
Binding Proteins
Examples of known interacting proteins
hiddentext
| No. | Name – UniProt ID |
|---|---|
| 1 | BMPR1B - O00238 |
Regulation
Activation:
NA
Inhibition:
NA
Synthesis:
NA
Degradation:
NA
Protein Kinase Specificity
Matrix of observed frequency (%) of amino acids in aligned protein substrate phosphosites
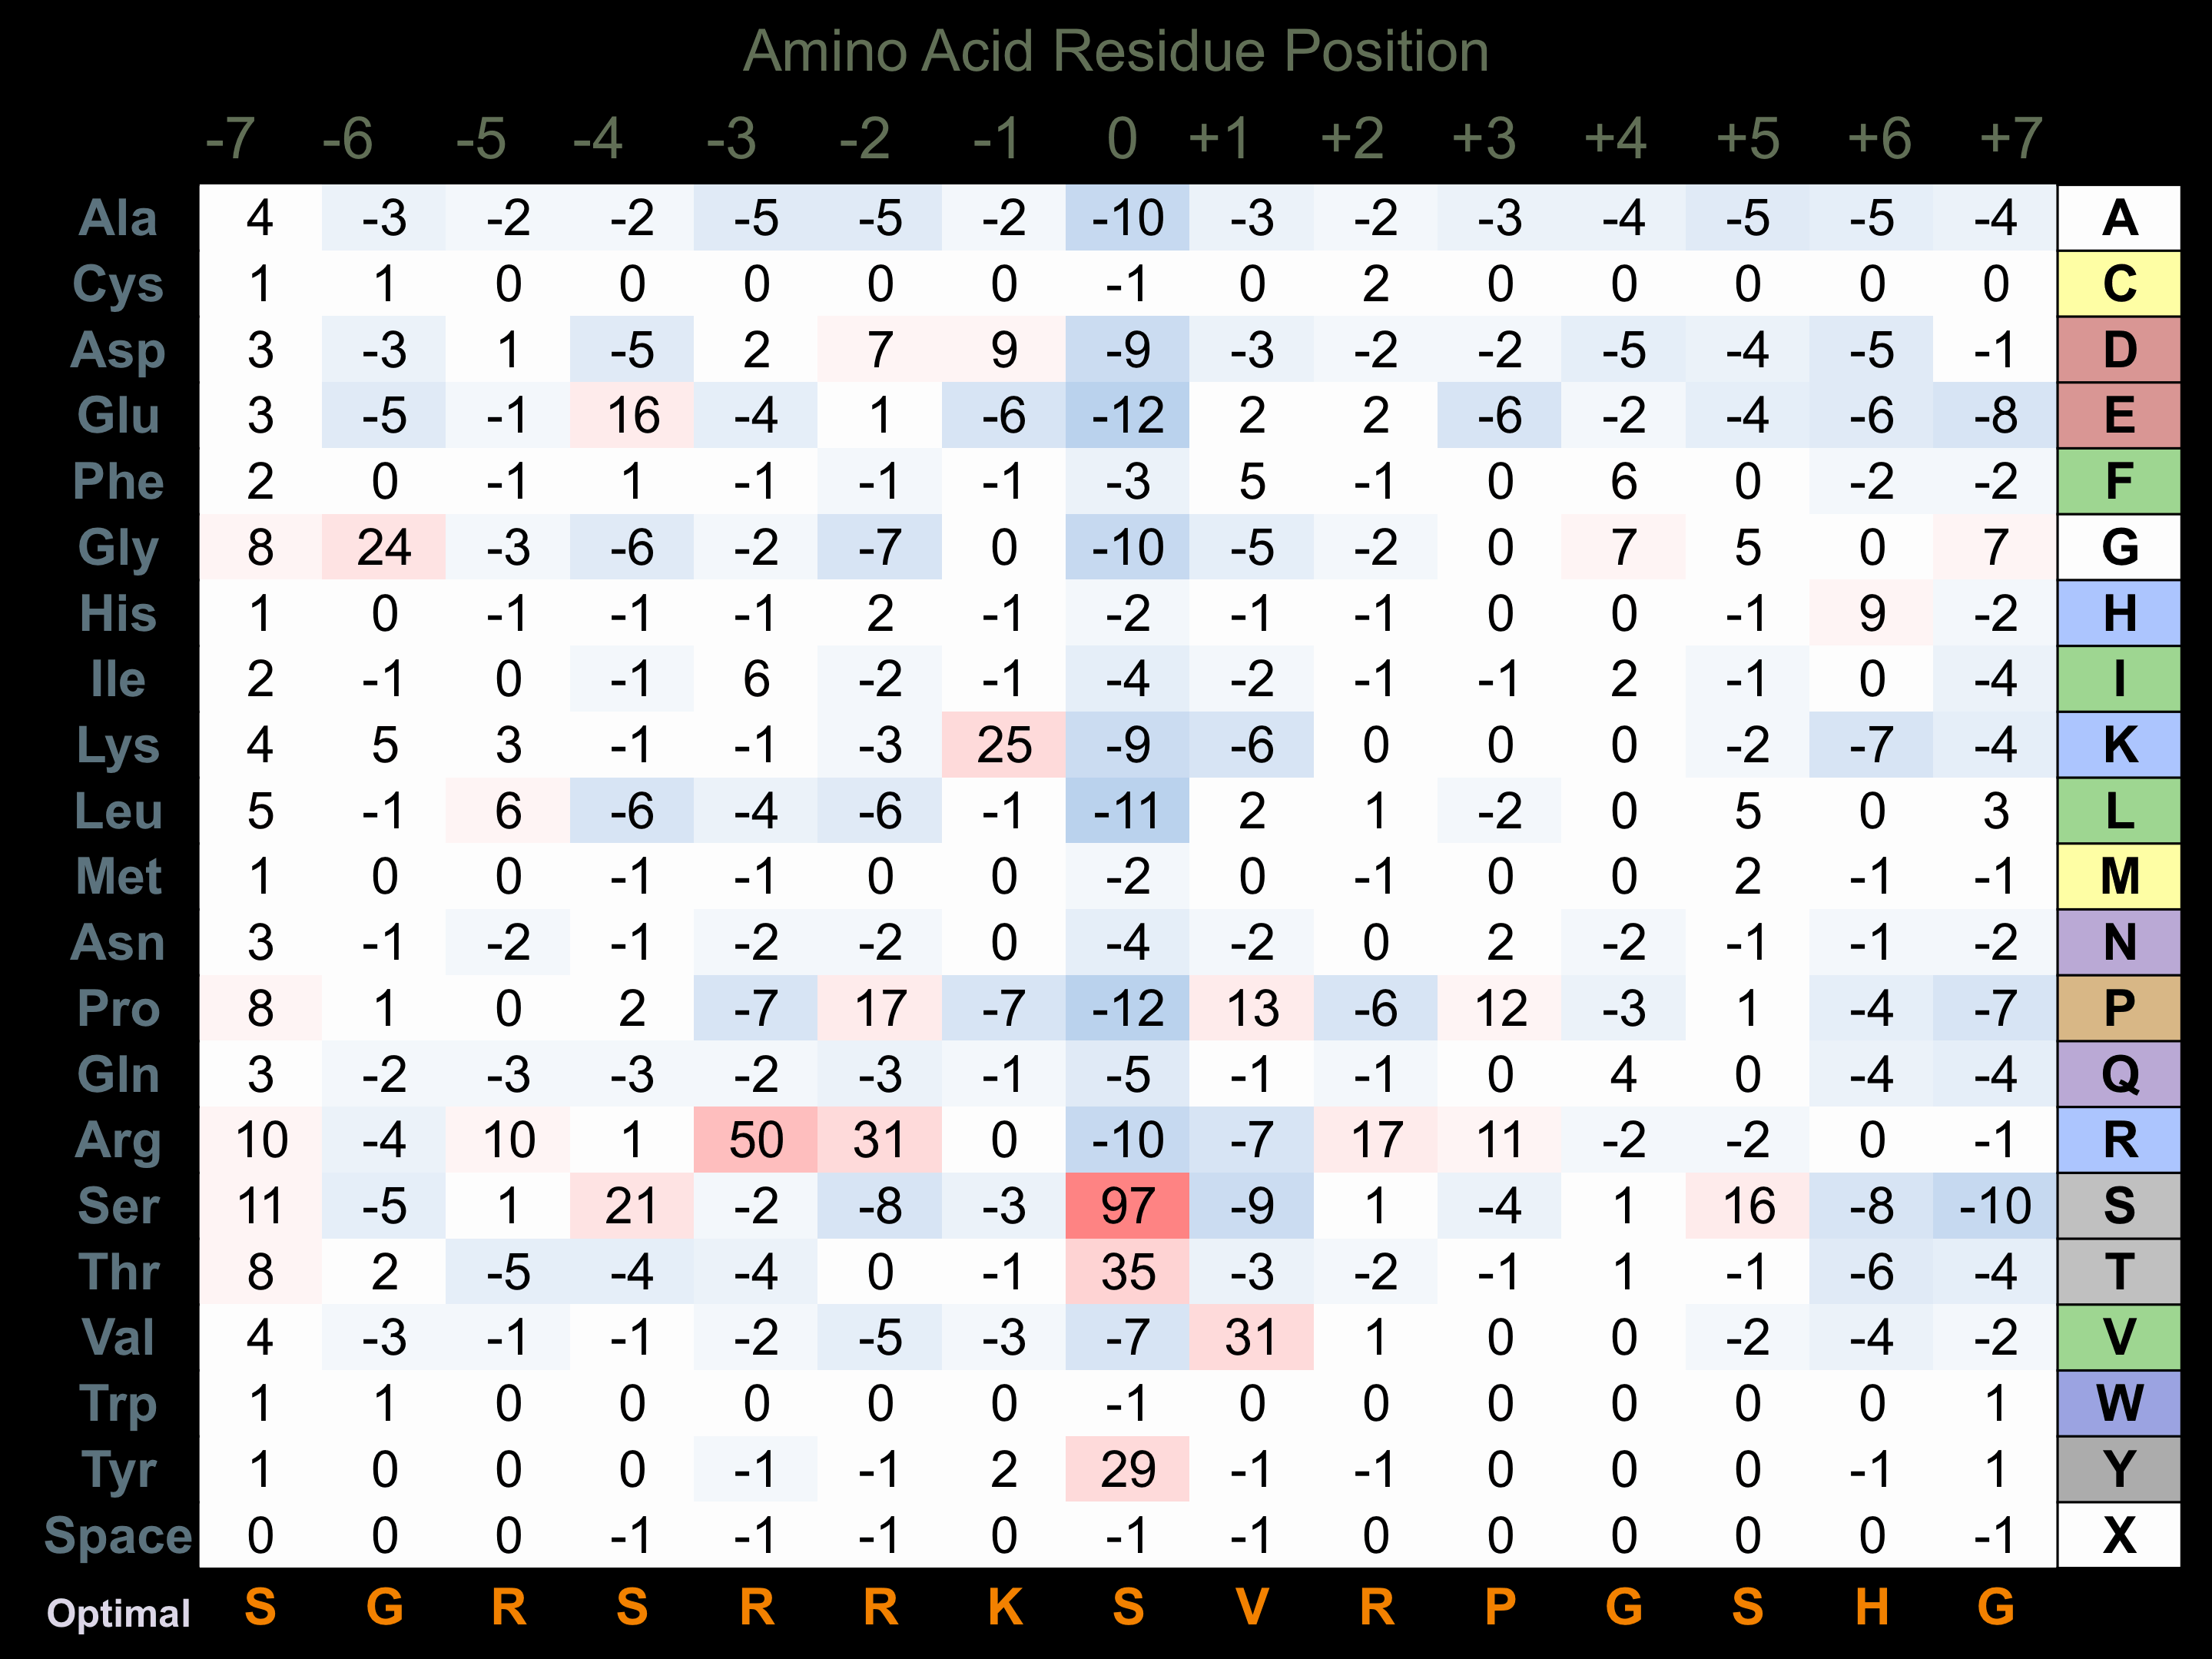
Matrix Type:
Predicted from the application of the Kinexus Kinase Substrate Predictor Version 2.0 algorithm, which was trained with over 10,000 kinase-protein substrate pairs and 8,000 kinase-peptide substrate pairs.
Domain #:
1
Inhibitors
For further details on these inhibitors click on the Compound Name and enter it into DrugKiNET or click on the ID's
Based on in vitro and/or in vivo phosphorylation data
| Compound Name | KD, Ki or IC50 (nM) | PubChem ID | ChEMBL ID | PubMed ID |
|---|
Disease Linkage
Comments:
CLIK1 levels are up-regulated 1-8-fold in human tumours compared to most other protein kinases.
Gene Expression in Cancers:
TranscriptoNET (www.transcriptonet.ca) analysis with mRNA expression data retrieved from the National Center for Biotechnology Information's Gene Expression Omnibus (GEO) database, which was normalized against 60 abundantly and commonly found proteins, indicated altered expression for this protein kinase as shown here as the percent change from normal tissue controls (%CFC) as supported with the Student T-test in the following types of human cancers: Brain glioblastomas (%CFC= +98, p<0.073); and Ovary adenocarcinomas (%CFC= -96, p<0.0002). The COSMIC website notes an up-regulated expression score for CLIK1 in diverse human cancers of 849, which is 1.8-fold of the average score of 462 for the human protein kinases. The down-regulated expression score of 102 for this protein kinase in human cancers was 1.7-fold of the average score of 60 for the human protein kinases.
Mutagenesis Experiments:
Insertional mutagenesis studies in mice have not yet revealed a role for this protein kinase in mouse cancer oncogenesis.
Mutation Rate in All Cancers:
Percent mutation rates per 100 amino acids length in human cancers: 0.04 % in 24726 diverse cancer specimens. This rate is -45 % lower than the average rate of 0.075 % calculated for human protein kinases in general.
Mutation Rate in Specific Cancers:
Highest percent mutation rates per 100 amino acids length in human cancers: 0.19 % in 1270 large intestine cancers tested; 0.1 % in 1634 lung cancers tested; 0.09 % in 1512 liver cancers tested.
Frequency of Mutated Sites:
None > 4 in 20,010 cancer specimens
Comments:
Only 1 insertion, and no deletions or complex mutations are noted on the COSMIC website.