
Nomenclature
Short Name:
CLK3
Full Name:
Dual specificity protein kinase CLK3
Alias:
- CDC like kinase 3
- EC 2.7.12.1
- FLJ22858
- PHCLK3
- PHCLK3/152
Classification
Type:
Protein-serine/threonine kinase
Group:
CMGC
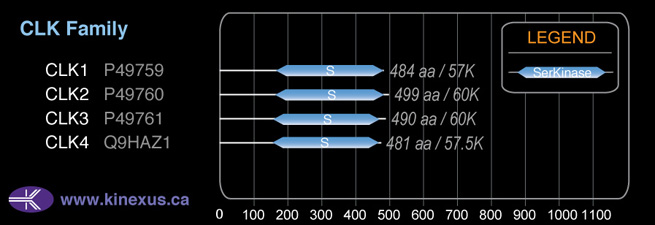
Family:
CLK
SubFamily:
NA

Specific Links
Structure
Mol. Mass (Da):
58588
# Amino Acids:
490
# mRNA Isoforms:
4
mRNA Isoforms:
73,515 Da (638 AA; P49761); 58,588 Da (490 AA; P49761-1); 56,207 Da (467 AA; P49761-3); 18,971 Da (152 AA; P49761-2)
4D Structure:
NA
1D Structure:
3D Image (rendered using PV Viewer):
PDB ID
Subfamily Alignment
Domain Distribution:
| Start | End | Domain |
|---|---|---|
| 304 | 620 | Pkinase |
Kinexus Products
Click on entries below for direct links to relevant products from Kinexus for this protein kinase.
hiddentext
Post-translation Modifications
For detailed information on phosphorylation of this kinase go to PhosphoNET
Serine phosphorylated:
S157, S165, S175, S197, S199, S215, S224, S226, S265, S270, S271, S280, S281, S283.
Threonine phosphorylated:
T217, T314.
Tyrosine phosphorylated:
Y155, Y163, Y166, Y218, Y232.
Ubiquitinated:
K317, K460, K557, K573, K123.
Distribution
Based on gene microarray analysis from the NCBI
Human Tissue Distribution
% Max Expression:
Mean Expression:
Number of Samples:
Standard Deviation:
% Max Expression:
Mean Expression:
Number of Samples:
Standard Deviation:
 14
14
1055
16
944
 2
2
185
10
92
 1.4
1.4
110
1
0
 6
6
495
86
960
 12
12
890
14
726
 3
3
204
43
364
 6
6
463
19
631
 13
13
991
20
1521
 9
9
728
10
525
 3
3
251
44
233
 20
20
1550
43
4167
 10
10
784
105
693
 2
2
129
12
31
 2
2
180
9
164
 2
2
136
11
69
 1.4
1.4
110
8
33
 2
2
132
104
63
 3
3
247
7
133
 8
8
633
88
2124
 9
9
727
56
718
 2
2
180
10
54
 3
3
259
12
148
 2
2
142
10
91
 31
31
2381
48
5754
 4
4
323
10
224
 18
18
1358
28
1798
 2
2
189
15
127
 3
3
246
8
183
 3
3
267
8
184
 9
9
669
14
157
 15
15
1125
18
710
 100
100
7705
33
9773
 0.9
0.9
66
56
96
 10
10
780
31
707
 7
7
563
22
589
Evolution
Species Conservation
PhosphoNET % Identity:
PhosphoNET % Similarity:
Homologene %
Identity:
PhosphoNET % Identity:
PhosphoNET % Similarity:
Homologene %
Identity:
 100
100
100
100 76.7
76.7
76.7
100 98
98
98.3
98 -
-
-
99 -
-
-
100 59.4
59.4
59.6
99 -
-
-
- 88.9
88.9
89.7
88 76
76
76.3
99 -
-
-
- -
-
-
- 65.8
65.8
70.7
84 53.3
53.3
63.5
77.5 51.1
51.1
63.3
- -
-
-
- 34
34
49.9
- 43.3
43.3
53.9
- -
-
-
- -
-
-
- -
-
-
- -
-
-
- -
-
-
- 30.7
30.7
44.5
- 23.7
23.7
41.8
- -
-
-
-
For a wider analysis go to PhosphoNET Evolution in PhosphoNET
Binding Proteins
Examples of known interacting proteins
hiddentext
| No. | Name – UniProt ID |
|---|---|
| 1 | C1orf63 - Q9BUV0 |
| 2 | YWHAG - P61981 |
Regulation
Activation:
NA
Inhibition:
NA
Synthesis:
NA
Degradation:
NA
Protein Kinase Specificity
Matrix of observed frequency (%) of amino acids in aligned protein substrate phosphosites
Matrix Type:
Predicted from the application of the Kinexus Kinase Substrate Predictor Version 2.0 algorithm, which was trained with over 10,000 kinase-protein substrate pairs and 8,000 kinase-peptide substrate pairs.
Domain #:
1
Inhibitors
For further details on these inhibitors click on the Compound Name and enter it into DrugKiNET or click on the ID's
Based on in vitro and/or in vivo phosphorylation data
| Compound Name | KD, Ki or IC50 (nM) | PubChem ID | ChEMBL ID | PubMed ID |
|---|
Disease Linkage
Gene Expression in Cancers:
TranscriptoNET (www.transcriptonet.ca) analysis with mRNA expression data retrieved from the National Center for Biotechnology Information's Gene Expression Omnibus (GEO) database, which was normalized against 60 abundantly and commonly found proteins, indicated altered expression for this protein kinase as shown here as the percent change from normal tissue controls (%CFC) as supported with the Student T-test in the following types of human cancers: Large B-cell lymphomas (%CFC= +45, p<0.041); Large B-cell lymphomas (%CFC= +45, p<0.047); and Skin melanomas - malignant (%CFC= +66, p<0.0001). The COSMIC website notes an up-regulated expression score for CLK3 in diverse human cancers of 416, which is 0.9-fold of the average score of 462 for the human protein kinases. The down-regulated expression score of 99 for this protein kinase in human cancers was 1.7-fold of the average score of 60 for the human protein kinases.
Mutagenesis Experiments:
Insertional mutagenesis studies in mice have not yet revealed a role for this protein kinase in mouse cancer oncogenesis.
Mutation Rate in All Cancers:
Percent mutation rates per 100 amino acids length in human cancers: 0.07 % in 24751 diverse cancer specimens. This rate is only -4 % lower and is very similar to the average rate of 0.075 % calculated for human protein kinases in general.
Mutation Rate in Specific Cancers:
Highest percent mutation rates per 100 amino acids length in human cancers: 0.59 % in 589 stomach cancers tested; 0.26 % in 1270 large intestine cancers tested; 0.24 % in 603 endometrium cancers tested; 0.23 % in 710 oesophagus cancers tested; 0.09 % in 1316 breast cancers tested.
Frequency of Mutated Sites:
None > 2 in 20,034 cancer specimens
Comments:
Only 2 deletions, 1 insertion, and no complex mutations are noted on the COSMIC website.