
Nomenclature
Short Name:
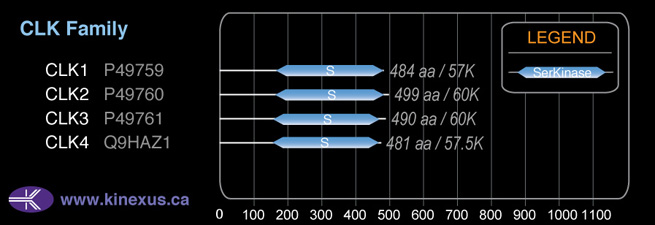
CLK4
Full Name:
Dual specificity protein kinase CLK4
Alias:
- EC 2.7.12.1
Classification
Type:
Protein-serine/threonine kinase
Group:
CMGC
Family:
CLK
SubFamily:
NA

Structure
Mol. Mass (Da):
57,492
# Amino Acids:
481
# mRNA Isoforms:
1
mRNA Isoforms:
57,492 Da (481 AA; Q9HAZ1)
4D Structure:
Interacts with UBL5.
1D Structure:
Subfamily Alignment
Domain Distribution:
| Start | End | Domain |
|---|---|---|
| 159 | 475 | Pkinase |
Post-translation Modifications
For detailed information on phosphorylation of this kinase go to PhosphoNET
Serine phosphorylated:
S17, S33, S35, S122, S123, S126, S128, S136, S138, S326, S335+, S339-.
Threonine phosphorylated:
T336+, T340-.
Tyrosine phosphorylated:
Y76, Y80, Y343-.
Distribution
Based on gene microarray analysis from the NCBI
Human Tissue Distribution
% Max Expression:
Mean Expression:
Number of Samples:
Standard Deviation:
% Max Expression:
Mean Expression:
Number of Samples:
Standard Deviation:
 100
100
1348
34
956
 5
5
63
11
29
 37
37
497
10
324
 25
25
336
128
536
 64
64
858
41
609
 7
7
92
64
65
 5
5
72
45
91
 45
45
603
33
806
 51
51
684
10
618
 10
10
133
83
97
 27
27
362
23
410
 68
68
914
103
607
 47
47
631
21
790
 14
14
192
6
131
 34
34
463
20
441
 3
3
44
22
57
 14
14
184
155
197
 26
26
357
15
308
 19
19
252
82
283
 63
63
846
135
681
 36
36
491
19
426
 61
61
823
21
844
 57
57
766
11
592
 56
56
754
15
809
 75
75
1009
19
812
 59
59
796
87
628
 29
29
396
24
458
 35
35
468
15
448
 47
47
636
15
632
 6
6
79
42
65
 80
80
1079
18
464
 35
35
475
36
698
 6
6
78
53
92
 61
61
818
104
671
 81
81
1095
61
1898
Evolution
Species Conservation
PhosphoNET % Identity:
PhosphoNET % Similarity:
Homologene %
Identity:
PhosphoNET % Identity:
PhosphoNET % Similarity:
Homologene %
Identity:
 100
100
100
100 90.8
90.8
91.5
99 99.4
99.4
99.8
- -
-
-
97 -
-
-
97 98.1
98.1
99.2
98 -
-
-
- 97.1
97.1
98.5
97 52
52
66.7
99 -
-
-
- 90.8
90.8
94.2
- 22.1
22.1
39.2
84 68.2
68.2
78.6
- 53.4
53.4
68.1
64 -
-
-
- 31.9
31.9
43.8
- -
-
-
- -
-
-
- -
-
-
- -
-
-
- -
-
-
- -
-
-
46 39.7
39.7
58.2
45 26.6
26.6
44.2
- -
-
-
45
For a wider analysis go to PhosphoNET Evolution in PhosphoNET
Binding Proteins
Examples of known interacting proteins
hiddentext
| No. | Name – UniProt ID |
|---|---|
| 1 | UBL5 - Q9BZL1 |
| 2 | SFRS16 - Q8N2M8 |
| 3 | HSPB2 - Q16082 |
Regulation
Activation:
NA
Inhibition:
NA
Synthesis:
NA
Degradation:
NA
Known Downstream Substrates
For further details on these substrates click on the Substrate Short Name or UniProt ID. Phosphosite Location is hyperlinked to PhosphoNET
predictions.
Based on in vitro and/or in vivo phosphorylation data
| Substrate Short Name | UniProt ID (Human) | Phosphosite Location | Phosphosite Sequence | Effect of Phosphorylation |
|---|
Protein Kinase Specificity
Matrix of observed frequency (%) of amino acids in aligned protein substrate phosphosites
Matrix Type:
Predicted from the application of the Kinexus Kinase Substrate Predictor Version 2.0 algorithm, which was trained with over 10,000 kinase-protein substrate pairs and 8,000 kinase-peptide substrate pairs.
Domain #:
1
Inhibitors
For further details on these inhibitors click on the Compound Name and enter it into DrugKiNET or click on the ID's
Based on in vitro and/or in vivo phosphorylation data
| Compound Name | KD, Ki or IC50 (nM) | PubChem ID | ChEMBL ID | PubMed ID |
|---|
Disease Linkage
Gene Expression in Cancers:
TranscriptoNET (www.transcriptonet.ca) analysis with mRNA expression data retrieved from the National Center for Biotechnology Information's Gene Expression Omnibus (GEO) database, which was normalized against 60 abundantly and commonly found proteins, indicated altered expression for this protein kinase as shown here as the percent change from normal tissue controls (%CFC) as supported with the Student T-test in the following types of human cancers: Bladder carcinomas (%CFC= +60, p<0.006); Clear cell renal cell carcinomas (cRCC) (%CFC= +53, p<0.039); Clear cell renal cell carcinomas (cRCC) stage I (%CFC= -69, p<0.0001); and Skin melanomas - malignant (%CFC= -61, p<0.0008).
Mutagenesis Experiments:
Insertional mutagenesis studies in mice have not yet revealed a role for this protein kinase in mouse cancer oncogenesis. K189R mutation can lead to loss of function.
Mutation Rate in All Cancers:
Percent mutation rates per 100 amino acids length in human cancers: 0.07 % in 24433 diverse cancer specimens. This rate is only -13 % lower than the average rate of 0.075 % calculated for human protein kinases in general.
Mutation Rate in Specific Cancers:
Highest percent mutation rates per 100 amino acids length in human cancers: 0.39 % in 1270 large intestine cancers tested; 0.34 % in 603 endometrium cancers tested; 0.22 % in 555 stomach cancers tested.
Frequency of Mutated Sites:
Most frequent mutations with the number of reports indicated in brackets: R2W (8); R2L (2).
Comments:
Only 1 deletion (at C-terminus) and 2 insertions and no complex mutations are noted on the COSMIC website.