
Nomenclature
Short Name:
CRIK
Full Name:
Citron Rho-interacting kinase
Alias:
- CIT
- Citron
- Rho-interacting, serine/threonine kinase 21
- STK21
- Citron protein
- CTRO
- EC 2.7.11.1
- KIAA0949
Classification
Type:
Protein-serine/threonine kinase
Group:
AGC
Family:
DMPK
SubFamily:
NA

Structure
Mol. Mass (Da):
231,431
# Amino Acids:
2027
# mRNA Isoforms:
4
mRNA Isoforms:
236,607 Da (2069 AA; O14578-4); 231,431 Da (2027 AA; O14578); 177,035 Da (1544 AA; O14578-3); 54,399 Da (482 AA; O14578-2)
4D Structure:
Directly interacts with KIF14 depending on the activation state (stronger interaction with the kinase-dead form). Homodimer By similarity. Interacts with TTC3
1D Structure:
3D Image (rendered using PV Viewer):
PDB ID
Subfamily Alignment
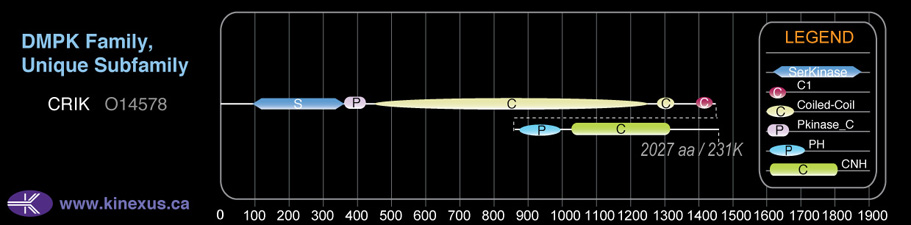
Domain Distribution:
| Start | End | Domain |
|---|---|---|
| 97 | 360 | Pkinase |
| 361 | 431 | Pkinase_C |
| 454 | 1246 | Coiled-coil |
| 1284 | 1325 | Coiled-coil |
| 1391 | 1439 | C1 |
| 1443 | 1563 | PH |
| 1591 | 1881 | CNH |
Post-translation Modifications
For detailed information on phosphorylation of this kinase go to PhosphoNET
Acetylated:
K117, K126, K362, K1721 (N6).
Serine phosphorylated:
S308, S371, S431, S433, S436, S440, S480, S582, S772, S794, S841, S846, S989, S1137, S1305, S1322, S1343, S1432, S1473, S1939, S1940, S1948, S1954, S1971, S1981, S1987, S1993, S2025, S2026.
Threonine phosphorylated:
T232, T307, T741, T1306, T1345, T1382, T1410, T1419, T1760, T1934, T1955, T2013.
Tyrosine phosphorylated:
Y969, Y1417, Y1467, Y1759, Y1929.
Ubiquitinated:
K95, K380.
Distribution
Based on gene microarray analysis from the NCBI
Human Tissue Distribution
% Max Expression:
Mean Expression:
Number of Samples:
Standard Deviation:
% Max Expression:
Mean Expression:
Number of Samples:
Standard Deviation:
 32
32
1087
22
1404
 6
6
200
11
188
 5
5
182
1
0
 15
15
522
77
818
 14
14
473
22
388
 2
2
80
46
53
 5
5
170
29
356
 100
100
3370
23
7072
 6
6
186
10
141
 3
3
106
73
112
 2
2
71
16
88
 21
21
705
105
705
 3
3
85
12
16
 2
2
82
6
90
 0.9
0.9
29
13
26
 5
5
158
13
163
 0.6
0.6
19
106
32
 2
2
78
6
85
 3
3
89
61
81
 14
14
471
84
425
 3
3
96
14
122
 3
3
103
16
113
 6
6
195
2
66
 4
4
149
8
181
 2
2
75
14
91
 59
59
1974
42
4756
 3
3
104
15
52
 3
3
86
7
105
 3
3
98
6
110
 9
9
307
28
257
 19
19
645
18
434
 70
70
2361
26
3800
 1.1
1.1
38
67
305
 26
26
873
52
761
 3
3
117
35
93
Evolution
Species Conservation
PhosphoNET % Identity:
PhosphoNET % Similarity:
Homologene %
Identity:
PhosphoNET % Identity:
PhosphoNET % Similarity:
Homologene %
Identity:
 100
100
100
100 99.7
99.7
99.9
100 97.6
97.6
97.8
100 -
-
-
96 -
-
-
95 -
-
-
98 -
-
-
- 94.6
94.6
96.5
97 24.3
24.3
42.3
97 -
-
-
- 23.6
23.6
26.7
- 90.2
90.2
96
90 -
-
-
83 36
36
45.5
72.5 -
-
-
- 23.1
23.1
41.5
33.5 -
-
-
- -
-
-
- 26.4
26.4
41.6
- -
-
-
- -
-
-
- -
-
-
- -
-
-
- -
-
-
- -
-
-
-
For a wider analysis go to PhosphoNET Evolution in PhosphoNET
Binding Proteins
Examples of known interacting proteins
hiddentext
| No. | Name – UniProt ID |
|---|---|
| 1 | DLG4 - P78352 |
| 2 | RND3 - P61587 |
| 3 | DISC1 - Q9NRI5 |
| 4 | RAC1 - P63000 |
| 5 | RHOC - P08134 |
| 6 | RHOB - P62745 |
| 7 | GRIN1 - Q05586 |
| 8 | GRIN2D - O15399 |
| 9 | ROCK2 - O75116 |
Regulation
Activation:
NA
Inhibition:
NA
Synthesis:
NA
Degradation:
NA
Known Downstream Substrates
For further details on these substrates click on the Substrate Short Name or UniProt ID. Phosphosite Location is hyperlinked to PhosphoNET
predictions.
Based on in vitro and/or in vivo phosphorylation data
| Substrate Short Name | UniProt ID (Human) | Phosphosite Location | Phosphosite Sequence | Effect of Phosphorylation |
|---|
| MRLC1 (MYL9) | P24844 | S20 | KRPQRATSNVFAMFD | |
| MRLC1 (MYL9) | P24844 | T19 | KKRPQRATSNVFAMF |
Protein Kinase Specificity
Matrix of observed frequency (%) of amino acids in aligned protein substrate phosphosites
Matrix Type:
Predicted from the application of the Kinexus Kinase Substrate Predictor Version 2.0 algorithm, which was trained with over 10,000 kinase-protein substrate pairs and 8,000 kinase-peptide substrate pairs.
Domain #:
1
Inhibitors
For further details on these inhibitors click on the Compound Name and enter it into DrugKiNET or click on the ID's
Based on in vitro and/or in vivo phosphorylation data
| Compound Name | KD, Ki or IC50 (nM) | PubChem ID | ChEMBL ID | PubMed ID |
|---|
Disease Linkage
General Disease Association:
Neurological, blood disorders and mental disorders
Specific Diseases (Non-cancerous):
Schizophrenia; Bipolar disorder; Citrullinemia
Comments:
Polymorphisms in the CRIK gene are related to bipolar disorder and predispose to schizophrenia. The protein plays a role in cell division through KIF14, promotes efficient cytokinesis, and development of the central nervous system.
Gene Expression in Cancers:
TranscriptoNET (www.transcriptonet.ca) analysis with mRNA expression data retrieved from the National Center for Biotechnology Information's Gene Expression Omnibus (GEO) database, which was normalized against 60 abundantly and commonly found proteins, indicated altered expression for this protein kinase as shown here as the percent change from normal tissue controls (%CFC) as supported with the Student T-test in the following types of human cancers: Brain glioblastomas (%CFC= +206, p<0.082); Clear cell renal cell carcinomas (cRCC) stage I (%CFC= -90, p<0.0001); Lung adenocarcinomas (%CFC= +301, p<0.0002); Skin fibrosarcomas (%CFC= +106); T-cell prolymphocytic leukemia (%CFC= +183, p<0.014); and Vulvar intraepithelial neoplasia (%CFC= +128, p<0.03).
Mutagenesis Experiments:
Insertional mutagenesis studies in mice have not yet revealed a role for this protein kinase in mouse cancer oncogenesis.
Mutation Rate in All Cancers:
Percent mutation rates per 100 amino acids length in human cancers: 0.07 % in 24447 diverse cancer specimens. This rate is only -9 % lower and is very similar to the average rate of 0.075 % calculated for human protein kinases in general.
Mutation Rate in Specific Cancers:
Highest percent mutation rates per 100 amino acids length in human cancers: 0.26 % in 864 skin cancers tested; 0.26 % in 1270 large intestine cancers tested; 0.23 % in 569 stomach cancers tested; 0.21 % in 603 endometrium cancers tested; 0.15 % in 548 urinary tract cancers tested; 0.11 % in 1608 lung cancers tested; 0.1 % in 1289 breast cancers tested; 0.08 % in 65 Meninges cancers tested; 0.07 % in 273 cervix cancers tested; 0.07 % in 1512 liver cancers tested; 0.05 % in 958 upper aerodigestive tract cancers tested; 0.05 % in 833 ovary cancers tested; 0.05 % in 710 oesophagus cancers tested.
Frequency of Mutated Sites:
None > 3 in 20,071 cancer specimens
Comments:
Only 4 deletions, 2 insertions, and 1 complex mutation are noted on the COSMIC website.