
Nomenclature
Short Name:
CYGF
Full Name:
Retinal guanylyl cyclase 2
Alias:
- EC 4.6.1.2
- GC-F
- RETGC-2
- Rod outer segment membrane guanylate cyclase 2
- ROS-GC2
- Guanylate cyclase 2F, retinal
- Guanylate cyclase F
- GUC2F
- GUCY2F
Classification
Type:
Protein-serine/threonine kinase
Group:
RGC
Family:
RGC
SubFamily:
NA

Structure
Mol. Mass (Da):
124,822
# Amino Acids:
1108
# mRNA Isoforms:
1
mRNA Isoforms:
124,850 Da (1108 AA; P51841)
4D Structure:
NA
1D Structure:
Subfamily Alignment
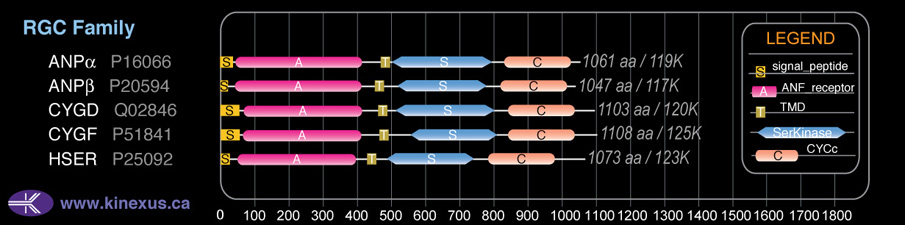
Domain Distribution:
| Start | End | Domain |
|---|---|---|
| 1 | 50 | signal_peptide |
| 71 | 415 | ANF_receptor |
| 468 | 490 | TMD |
| 533 | 821 | Pkinase |
| 848 | 1043 | CYCc |
| 884 | 1014 | Guanylate cyclase |
Post-translation Modifications
For detailed information on phosphorylation of this kinase go to PhosphoNET
Acetylated:
K1050, K1063, K1068.
Serine phosphorylated:
S171, S649, S868.
Threonine phosphorylated:
T168, T858, T966.
Distribution
Based on gene microarray analysis from the NCBI
Human Tissue Distribution
% Max Expression:
Mean Expression:
Number of Samples:
Standard Deviation:
% Max Expression:
Mean Expression:
Number of Samples:
Standard Deviation:
 20
20
243
13
330
 0.7
0.7
9
12
8
 4
4
48
17
47
 12
12
150
60
355
 18
18
220
14
214
 0.2
0.2
2
37
2
 23
23
289
23
402
 17
17
211
34
419
 16
16
201
10
209
 4
4
44
73
66
 2
2
28
33
32
 25
25
308
135
472
 2
2
23
26
33
 0.7
0.7
9
9
13
 3
3
34
28
53
 0.3
0.3
4
9
5
 2
2
19
201
28
 6
6
70
23
164
 1
1
14
64
13
 18
18
226
56
287
 2
2
26
28
30
 2
2
21
29
28
 4
4
44
25
40
 2
2
22
25
34
 3
3
36
29
48
 19
19
236
42
401
 1
1
16
31
21
 3
3
32
24
41
 2
2
24
24
28
 2
2
23
14
7
 29
29
357
18
260
 100
100
1232
21
2713
 16
16
200
45
431
 42
42
514
31
534
 3
3
39
22
31
Evolution
Species Conservation
PhosphoNET % Identity:
PhosphoNET % Similarity:
Homologene %
Identity:
PhosphoNET % Identity:
PhosphoNET % Similarity:
Homologene %
Identity:
 100
100
100
100 0
0
0
97 97.5
97.5
98.1
97.5 -
-
-
90 -
-
-
- 91.4
91.4
94.7
91 -
-
-
- 89.9
89.9
93.7
90 89.8
89.8
93.5
90 -
-
-
- 51.3
51.3
67.2
- 60.7
60.7
75
61.5 -
-
-
72 61.9
61.9
75.9
64 -
-
-
- 31.5
31.5
48.6
52 -
-
-
- 29.5
29.5
47.9
- 32.5
32.5
50.4
- -
-
-
- -
-
-
- -
-
-
- -
-
-
- -
-
-
- -
-
-
-
For a wider analysis go to PhosphoNET Evolution in PhosphoNET
Binding Proteins
Examples of known interacting proteins
hiddentext
| No. | Name – UniProt ID |
|---|---|
| 1 | GUCA1B - Q9UMX6 |
Regulation
Activation:
Activated by binding GCAP-1.
Inhibition:
Inhibited by calcium.
Synthesis:
NA
Degradation:
NA
Protein Kinase Specificity
Matrix of observed frequency (%) of amino acids in aligned protein substrate phosphosites
Matrix Type:
Predicted from the application of the Kinexus Kinase Substrate Predictor Version 2.0 algorithm, which was trained with over 10,000 kinase-protein substrate pairs and 8,000 kinase-peptide substrate pairs.
Domain #:
1
Disease Linkage
Gene Expression in Cancers:
The COSMIC website notes an up-regulated expression score for CYGF in diverse human cancers of 506, which is 1.1-fold of the average score of 462 for the human protein kinases. The down-regulated expression score of 0 for this protein kinase in human cancers was 100% lower than average score of 60 for the human protein kinases.
Mutagenesis Experiments:
Insertional mutagenesis studies in mice have not yet revealed a role for this protein kinase in mouse cancer oncogenesis.
Mutation Rate in All Cancers:
Percent mutation rates per 100 amino acids length in human cancers: 0.1 % in 24917 diverse cancer specimens. This rate is only 34 % higher than the average rate of 0.075 % calculated for human protein kinases in general.
Mutation Rate in Specific Cancers:
Highest percent mutation rates per 100 amino acids length in human cancers: 0.43 % in 1296 large intestine cancers tested; 0.4 % in 864 skin cancers tested; 0.31 % in 603 endometrium cancers tested; 0.25 % in 589 stomach cancers tested; 0.25 % in 1685 lung cancers tested; 0.2 % in 273 cervix cancers tested; 0.15 % in 238 bone cancers tested; 0.11 % in 710 oesophagus cancers tested; 0.1 % in 833 ovary cancers tested; 0.06 % in 1512 liver cancers tested.
Frequency of Mutated Sites:
Most frequent mutations with the number of reports indicated in brackets: R493H (4); R493C (3); R10P (3).
Comments:
Only 2 deletions, and no insertions or complex mutations are noted on the COSMIC website.