
Nomenclature
Short Name:
DAPK2
Full Name:
Death-associated protein kinase 2
Alias:
- DAP-kinase related protein 1
- DRP-1
- EC 2.7.11.1
- MGC119312
Classification
Type:
Protein-serine/threonine kinase
Group:
CAMK
Family:
DAPK
SubFamily:
NA

Structure
Mol. Mass (Da):
42,898
# Amino Acids:
370
# mRNA Isoforms:
2
mRNA Isoforms:
55,931 Da (488 AA; Q9UIK4-2); 42,898 Da (370 AA; Q9UIK4)
4D Structure:
Homodimer. Homodimerization is required for apoptotic function and is inhibited by autophosphorylation at Ser-318.
1D Structure:
3D Image (rendered using PV Viewer):
PDB ID
Subfamily Alignment
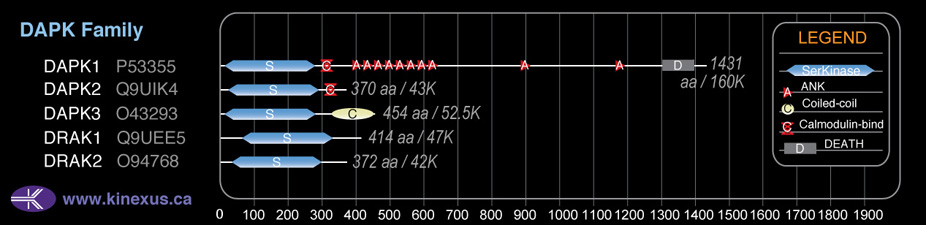
Domain Distribution:
| Start | End | Domain |
|---|---|---|
| 23 | 285 | Pkinase |
| 312 | 331 | CaM_binding |
Kinexus Products
Click on entries below for direct links to relevant products from Kinexus for this protein kinase.
hiddentext
Post-translation Modifications
For detailed information on phosphorylation of this kinase go to PhosphoNET
Serine phosphorylated:
S8, S299, S318-, S349, S367, S368+.
Threonine phosphorylated:
T190-.
Tyrosine phosphorylated:
Y49.
Distribution
Based on gene microarray analysis from the NCBI
Human Tissue Distribution
% Max Expression:
Mean Expression:
Number of Samples:
Standard Deviation:
% Max Expression:
Mean Expression:
Number of Samples:
Standard Deviation:
 100
100
868
29
1269
 4
4
33
15
33
 9
9
80
11
73
 34
34
298
93
524
 78
78
675
25
590
 5
5
47
79
95
 31
31
266
31
560
 77
77
670
43
1159
 70
70
611
17
498
 15
15
126
74
279
 6
6
50
32
56
 84
84
732
165
651
 7
7
57
34
82
 5
5
46
12
60
 14
14
119
27
199
 2
2
17
15
16
 10
10
83
121
83
 6
6
54
19
52
 7
7
64
87
48
 62
62
538
109
572
 8
8
71
25
64
 9
9
77
29
59
 11
11
95
14
98
 8
8
67
21
148
 6
6
52
25
56
 90
90
781
57
730
 4
4
35
37
48
 11
11
93
21
101
 7
7
58
21
77
 13
13
111
28
78
 49
49
421
24
414
 67
67
578
36
539
 7
7
63
73
81
 77
77
672
52
582
 10
10
84
35
69
Evolution
Species Conservation
PhosphoNET % Identity:
PhosphoNET % Similarity:
Homologene %
Identity:
PhosphoNET % Identity:
PhosphoNET % Similarity:
Homologene %
Identity:
 100
100
100
100 73.3
73.3
73.3
0 98.9
98.9
99.5
99 -
-
-
95 -
-
-
97 89.3
89.3
90.3
96 -
-
-
- 97.3
97.3
98.1
97 55.1
55.1
68.5
96 -
-
-
- 48.1
48.1
57.8
- 28.3
28.3
34.4
87 20.5
20.5
23.8
82.5 20.2
20.2
23.6
77 -
-
-
- 20
20
32
- -
-
-
- -
-
-
- -
-
-
- -
-
-
- -
-
-
- -
-
-
37 27
27
44.2
39 -
-
-
- -
-
-
-
For a wider analysis go to PhosphoNET Evolution in PhosphoNET
Binding Proteins
Examples of known interacting proteins
hiddentext
| No. | Name – UniProt ID |
|---|---|
| 1 | MLC1 - Q15049 |
| 2 | CAMK2A - Q9UQM7 |
| 3 | TGFBR1 - P36897 |
Regulation
Activation:
NA
Inhibition:
Negatively regulated by autophosphorylation on Ser-318.
Synthesis:
NA
Degradation:
NA
Known Upstream Kinases
For further details on these substrates click on the Substrate Short Name or UniProt ID. Phosphosite Location is hyperlinked to PhosphoNET
predictions.
Based on in vitro and/or in vivo phosphorylation data
| Kinase Short Name | UniProt ID (Human) | Phosphosite Location | Phosphosite Sequence | Effect of Phosphorylation |
|---|
Known Downstream Substrates
For further details on these substrates click on the Substrate Short Name or UniProt ID. Phosphosite Location is hyperlinked to PhosphoNET
predictions.
Based on in vitro and/or in vivo phosphorylation data
| Substrate Short Name | UniProt ID (Human) | Phosphosite Location | Phosphosite Sequence | Effect of Phosphorylation |
|---|
Protein Kinase Specificity
Matrix of observed frequency (%) of amino acids in aligned protein substrate phosphosites
Matrix Type:
Predicted from the application of the Kinexus Kinase Substrate Predictor Version 2.0 algorithm, which was trained with over 10,000 kinase-protein substrate pairs and 8,000 kinase-peptide substrate pairs.
Domain #:
1
Inhibitors
For further details on these inhibitors click on the Compound Name and enter it into DrugKiNET or click on the ID's
Based on in vitro and/or in vivo phosphorylation data
| Compound Name | KD, Ki or IC50 (nM) | PubChem ID | ChEMBL ID | PubMed ID |
|---|
Disease Linkage
General Disease Association:
Cancer
Specific Cancer Types:
Hodgkin lymphomas
Comments:
DAPK2 appears to be a tumour suppressor protein (TSP). DAPK2 phosphotransferase activity suppresses beta-catenin-dependent anchorage-independent growth of malignant epithelial cells, which implicates the kinase in tumorigenesis. Significantly reduced expression of DAPK2 has been observed in Hodgin lymphoma tumour cell lines. The introduction of a fusion protein between DAPK2 and CD30, which has constitutive kinase activity and enhanced pro-apoptotic function, leads to reduced tumour cell proliferation and increased apoptosis. Consequently, mutations in the DAPK2 gene that interfere with the tumor-suppressing activity of the DAPK2 protein are potentially contributing factors to the tumorigenesis of Hodgkin lymphoma.
Gene Expression in Cancers:
TranscriptoNET (www.transcriptonet.ca) analysis with mRNA expression data retrieved from the National Center for Biotechnology Information's Gene Expression Omnibus (GEO) database, which was normalized against 60 abundantly and commonly found proteins, indicated altered expression for this protein kinase as shown here as the percent change from normal tissue controls (%CFC) as supported with the Student T-test in the following types of human cancers: Breast epithelial carcinomas (%CFC= -62, p<0.042); Breast epithelial hyperplastic enlarged lobular units (HELU) (%CFC= -57, p<0.025); Cervical cancer stage 2B (%CFC= -74); Papillary thyroid carcinomas (PTC) (%CFC= +122, p<0.0006); Prostate cancer (%CFC= -56, p<0.092); Skin melanomas - malignant (%CFC= -76, p<0.0004); and Vulvar intraepithelial neoplasia (%CFC= -67, p<0.0001). The COSMIC website notes an up-regulated expression score for DAPK2 in diverse human cancers of 318, which is 0.7-fold of the average score of 462 for the human protein kinases. The down-regulated expression score of 3 for this protein kinase in human cancers was 0.1-fold of the average score of 60 for the human protein kinases.
Mutagenesis Experiments:
Insertional mutagenesis studies in mice support a role for this protein kinase in mouse cancer oncogenesis.
Mutation Rate in All Cancers:
Percent mutation rates per 100 amino acids length in human cancers: 0.07 % in 24726 diverse cancer specimens. This rate is only -2 % lower and is very similar to the average rate of 0.075 % calculated for human protein kinases in general.
Mutation Rate in Specific Cancers:
Highest percent mutation rates per 100 amino acids length in human cancers: 0.37 % in 805 skin cancers tested; 0.27 % in 1093 large intestine cancers tested.
Frequency of Mutated Sites:
None > 3 in 20,009 cancer specimens
Comments:
No deletions, insertions or complex mutations are noted on the COSMIC website.