
Nomenclature
Short Name:
EPHA3
Full Name:
Ephrin type-A receptor 3
Alias:
- EC 2.7.10.1
- EPA3
- HEK
- HEK4
- Kinase EphA3
- Tyrosine-protein kinase receptor REK4; Tyro4
- EPH receptor A3
- Ephrin type-A receptor 3
- ETK
- ETK1
Classification
Type:
Protein-tyrosine kinase
Group:
TK
Family:
Eph
SubFamily:
NA

Specific Links
Structure
Mol. Mass (Da):
110131
# Amino Acids:
983
# mRNA Isoforms:
2
mRNA Isoforms:
110,131 Da (983 AA; P29320); 60,946 Da (539 AA; P29320-2)
4D Structure:
NA
1D Structure:
3D Image (rendered using PV Viewer):
PDB ID
Subfamily Alignment
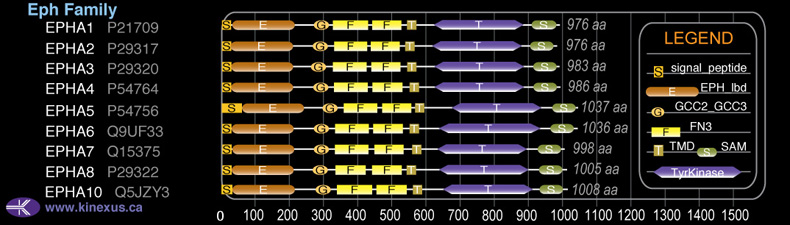
Domain Distribution:
Kinexus Products
Click on entries below for direct links to relevant products from Kinexus for this protein kinase.
hiddentext
Post-translation Modifications
For detailed information on phosphorylation of this kinase go to PhosphoNET
N-GlcNAcylated:
N232, N337, N391, N404, N493.
Serine phosphorylated:
S294, S497, S498, S768, S976.
Threonine phosphorylated:
T432, T442, T485, T595, T601, T654, T781, T974.
Tyrosine phosphorylated:
Y123, Y124, Y561, Y570, Y596+, Y602+, Y659, Y701, Y736, Y742+, Y779+, Y937.
Ubiquitinated:
K625, K656.
Distribution
Based on gene microarray analysis from the NCBI
Human Tissue Distribution
% Max Expression:
Mean Expression:
Number of Samples:
Standard Deviation:
% Max Expression:
Mean Expression:
Number of Samples:
Standard Deviation:
 100
100
789
42
1038
 2
2
13
20
18
 8
8
60
3
72
 25
25
195
114
306
 41
41
326
34
258
 2
2
13
111
28
 15
15
121
43
343
 54
54
429
39
437
 43
43
340
24
271
 3
3
24
102
41
 3
3
26
30
34
 57
57
450
223
428
 2
2
17
36
17
 2
2
12
15
10
 2
2
17
21
24
 0.9
0.9
7
22
9
 24
24
189
180
276
 2
2
17
14
16
 3
3
24
111
23
 37
37
295
162
345
 3
3
21
18
28
 2
2
15
24
22
 1
1
10
14
11
 2
2
13
14
11
 2
2
17
18
28
 77
77
610
62
615
 1
1
11
39
10
 2
2
17
13
15
 2
2
17
13
18
 2
2
18
42
18
 51
51
404
42
357
 69
69
546
57
987
 21
21
169
83
418
 67
67
527
83
503
 3
3
23
66
23
Evolution
Species Conservation
PhosphoNET % Identity:
PhosphoNET % Similarity:
Homologene %
Identity:
PhosphoNET % Identity:
PhosphoNET % Similarity:
Homologene %
Identity:
 100
100
100
100 40.9
40.9
60.5
99.5 98.8
98.8
99.1
99 -
-
-
97.5 -
-
-
- 94.6
94.6
96.2
97 -
-
-
- 95.6
95.6
97.7
96.5 95.6
95.6
97.5
96 -
-
-
- 90.4
90.4
93.5
- 91.5
91.5
94.5
92 62.6
62.6
77.9
85 58.5
58.5
75.3
- -
-
-
- -
-
-
- -
-
-
- -
-
-
- -
-
-
- -
-
-
- -
-
-
- -
-
-
- -
-
-
- -
-
-
- -
-
-
-
For a wider analysis go to PhosphoNET Evolution in PhosphoNET
Binding Proteins
Examples of known interacting proteins
hiddentext
| No. | Name – UniProt ID |
|---|---|
| 1 | EFNB2 - P52799 |
| 2 | ADAM10 - O14672 |
| 3 | TP53 - P04637 |
| 4 | CRK - P46108 |
| 5 | EFNA2 - O43921 |
| 6 | EFNB1 - P98172 |
| 7 | MLLT4 - P55196 |
Regulation
Activation:
Activated by binding ephrin-A1, A2, A3, A4 or A5. Phosphorylation of Tyr-596, Tyr-602 and Tyr-779 increases phosphotransferase activity and interaction with Crk.
Inhibition:
NA
Synthesis:
NA
Degradation:
NA
Protein Kinase Specificity
Matrix of observed frequency (%) of amino acids in aligned protein substrate phosphosites
Matrix Type:
Experimentally derived from alignment of 6 known protein substrate phosphosites and 30 peptides phosphorylated by recombinant EphA3 in vitro tested in-house by Kinexus.
Domain #:
1
Inhibitors
For further details on these inhibitors click on the Compound Name and enter it into DrugKiNET or click on the ID's
Based on in vitro and/or in vivo phosphorylation data
| Compound Name | KD, Ki or IC50 (nM) | PubChem ID | ChEMBL ID | PubMed ID |
|---|
Disease Linkage
General Disease Association:
Cancer
Specific Cancer Types:
Colorectal cancer (CRC); Pleomorphic rhabdomyosarcoma
Comments:
EphA3 is linked to Pleomorphic Rhabdomyosarcoma, which is a rare disease which is related to colorectal cancer, and can also affect the uterus, heart, and skeletal muscle tissues.
Gene Expression in Cancers:
TranscriptoNET (www.transcriptonet.ca) analysis with mRNA expression data retrieved from the National Center for Biotechnology Information's Gene Expression Omnibus (GEO) database, which was normalized against 60 abundantly and commonly found proteins, indicated altered expression for this protein kinase as shown here as the percent change from normal tissue controls (%CFC) as supported with the Student T-test in the following types of human cancers: Oral squamous cell carcinomas (OSCC) (%CFC= +127, p<0.08); Prostate cancer - metastatic (%CFC= -82, p<0.0001); and Vulvar intraepithelial neoplasia (%CFC= -58, p<0.057). The COSMIC website notes an up-regulated expression score for EPHA3 in diverse human cancers of 349, which is 0.8-fold of the average score of 462 for the human protein kinases. The down-regulated expression score of 0 for this protein kinase in human cancers was 100% lower than the average score of 60 for the human protein kinases.
Mutagenesis Experiments:
Insertional mutagenesis studies in mice have not yet revealed a role for this protein kinase in mouse cancer oncogenesis. EphA3 function can be inhibited and EFNA5 binding interrupted with the V133E, and F152L mutations. The EphA3 phosphotransferase activity can be decreased 10-fold with an Y596F mutation, but only when associated with the Y602F mutation. Full phosphotransferase activity can be restored when the Y596F, Y602F, and Y742F mutations occur concomitantly.
Mutation Rate in All Cancers:
Percent mutation rates per 100 amino acids length in human cancers: 0.2 % in 25668 diverse cancer specimens. This rate is 2.7-fold higher than the average rate of 0.075 % calculated for human protein kinases in general.
Mutation Rate in Specific Cancers:
Highest percent mutation rates per 100 amino acids length in human cancers: 1.19 % in 1119 large intestine cancers tested; 0.85 % in 805 skin cancers tested; 0.48 % in 589 stomach cancers tested; 0.48 % in 1992 lung cancers tested; 0.39 % in 605 oesophagus cancers tested; 0.32 % in 602 endometrium cancers tested; 0.19 % in 1270 liver cancers tested; 0.13 % in 904 ovary cancers tested; 0.12 % in 968 upper aerodigestive tract cancers tested; 0.07 % in 1962 central nervous system cancers tested; 0.07 % in 1525 breast cancers tested; 0.06 % in 1943 haematopoietic and lymphoid cancers tested.
Frequency of Mutated Sites:
Most frequent mutations with the number of reports indicated in brackets: R136* (5)
Comments:
Only 6 deletions, 1 insertion and 1 complex mutation noted on the COSMIC website.