
Nomenclature
Short Name:
EPHA8
Full Name:
Ephrin type-A receptor 8
Alias:
- EC 2.7.10.1
- KIAA1459
- Kinase EphA8
- Tyrosine-protein kinase receptor EEK
- EEK
- EPH- and ELK-related kinase
- EPH receptor A8
- EPH-and ELK-related kinase
- HEK3
Classification
Type:
Protein-tyrosine kinase
Group:
TK
Family:
Eph
SubFamily:
NA

Specific Links
Structure
Mol. Mass (Da):
111,003
# Amino Acids:
1005
# mRNA Isoforms:
2
mRNA Isoforms:
111,003 Da (1005 AA; P29322); 53,900 Da (495 AA; P29322-2)
4D Structure:
Interacts with FYN By similarity. Interacts with ANKS1B.
1D Structure:
3D Image (rendered using PV Viewer):
PDB ID
Subfamily Alignment
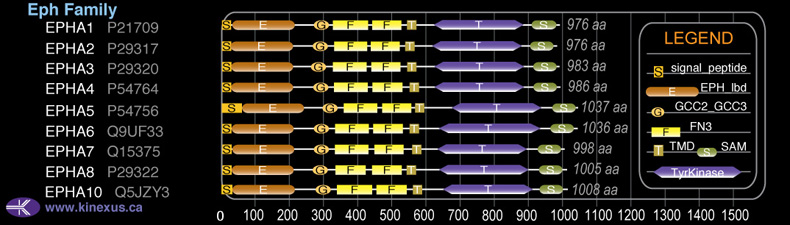
Domain Distribution:
Post-translation Modifications
For detailed information on phosphorylation of this kinase go to PhosphoNET
N-GlcNAcylated:
N340, N407, N432.
Serine phosphorylated:
S87, S177, S224, S225, S455, S457, S782, S909.
Threonine phosphorylated:
T86, T454, T498, T704, T905, T907.
Tyrosine phosphorylated:
Y478, Y616, Y715, Y793, Y839.
Distribution
Based on gene microarray analysis from the NCBI
Human Tissue Distribution
% Max Expression:
Mean Expression:
Number of Samples:
Standard Deviation:
% Max Expression:
Mean Expression:
Number of Samples:
Standard Deviation:
 87
87
1350
15
922
 0.7
0.7
11
5
14
 34
34
532
15
1020
 9
9
135
67
369
 31
31
476
20
296
 0.3
0.3
5
18
5
 0.5
0.5
8
23
9
 18
18
277
21
525
 0.3
0.3
5
3
1
 11
11
168
29
166
 17
17
268
21
501
 40
40
623
33
593
 27
27
420
16
797
 0.1
0.1
2
3
0
 46
46
725
21
1225
 1
1
18
10
18
 20
20
308
104
420
 100
100
1560
19
4202
 15
15
237
37
238
 29
29
454
54
243
 19
19
295
21
482
 20
20
312
21
573
 20
20
314
16
535
 15
15
236
19
485
 30
30
463
21
882
 33
33
517
51
576
 26
26
403
19
1141
 38
38
591
19
1628
 19
19
290
19
643
 67
67
1048
14
210
 44
44
679
24
53
 50
50
782
16
1417
 12
12
194
57
505
 53
53
833
52
728
 12
12
194
35
196
Evolution
Species Conservation
PhosphoNET % Identity:
PhosphoNET % Similarity:
Homologene %
Identity:
PhosphoNET % Identity:
PhosphoNET % Similarity:
Homologene %
Identity:
 100
100
100
100 41.3
41.3
60.9
0 99.3
99.3
99.6
99 -
-
-
97 -
-
-
- 73.8
73.8
75.4
97 -
-
-
- 95.1
95.1
97.1
95 56.1
56.1
72.8
95 -
-
-
- 57.3
57.3
73.3
- 56.9
56.9
73
82 56
56
71.3
- 56.3
56.3
71
- -
-
-
- -
-
-
- -
-
-
- -
-
-
- -
-
-
- -
-
-
- -
-
-
- -
-
-
- -
-
-
- -
-
-
- -
-
-
-
For a wider analysis go to PhosphoNET Evolution in PhosphoNET
Binding Proteins
Examples of known interacting proteins
hiddentext
| No. | Name – UniProt ID |
|---|---|
| 1 | EFNA5 - P52803 |
| 2 | FYN - P06241 |
| 3 | EFNA1 - P20827 |
| 4 | EFNA4 - P52798 |
| 5 | PIK3CG - P48736 |
| 6 | EFNA3 - P52797 |
| 7 | MLLT4 - P55196 |
Regulation
Activation:
Activated by binding ephrin-A2, A3, or A5. Phosphorylation of Tyr-616 induces interaction with Fyn.
Inhibition:
NA
Synthesis:
NA
Degradation:
NA
Known Upstream Kinases
For further details on these substrates click on the Substrate Short Name or UniProt ID. Phosphosite Location is hyperlinked to PhosphoNET
predictions.
Based on in vitro and/or in vivo phosphorylation data
| Kinase Short Name | UniProt ID (Human) | Phosphosite Location | Phosphosite Sequence | Effect of Phosphorylation |
|---|
Known Downstream Substrates
For further details on these substrates click on the Substrate Short Name or UniProt ID. Phosphosite Location is hyperlinked to PhosphoNET
predictions.
Based on in vitro and/or in vivo phosphorylation data
| Substrate Short Name | UniProt ID (Human) | Phosphosite Location | Phosphosite Sequence | Effect of Phosphorylation |
|---|
Protein Kinase Specificity
Matrix of observed frequency (%) of amino acids in aligned protein substrate phosphosites
Matrix Type:
Predicted from the application of the Kinexus Kinase Substrate Predictor Version 2.0 algorithm, which was trained with over 10,000 kinase-protein substrate pairs and 8,000 kinase-peptide substrate pairs.
Domain #:
1
Inhibitors
For further details on these inhibitors click on the Compound Name and enter it into DrugKiNET or click on the ID's
Based on in vitro and/or in vivo phosphorylation data
| Compound Name | KD, Ki or IC50 (nM) | PubChem ID | ChEMBL ID | PubMed ID |
|---|
Disease Linkage
Gene Expression in Cancers:
The COSMIC website notes an up-regulated expression score for EPHA8 in diverse human cancers of 208, which is 0.5-fold of the average score of 462 for the human protein kinases. The down-regulated expression score of 0 for this protein kinase in human cancers was 100% lower than average score of 60 for the human protein kinases.
Mutagenesis Experiments:
Insertional mutagenesis studies in mice have not yet revealed a role for this protein kinase in mouse cancer oncogenesis.
Mutation Rate in All Cancers:
Percent mutation rates per 100 amino acids length in human cancers: 0.11 % in 25377 diverse cancer specimens. This rate is a modest 1.49-fold higher than the average rate of 0.075 % calculated for human protein kinases in general.
Mutation Rate in Specific Cancers:
Highest percent mutation rates per 100 amino acids length in human cancers: 0.54 % in 805 skin cancers tested; 0.52 % in 1093 large intestine cancers tested; 0.46 % in 588 stomach cancers tested; 0.2 % in 500 urinary tract cancers tested; 0.17 % in 602 endometrium cancers tested; 0.17 % in 1941 lung cancers tested; 0.11 % in 1226 kidney cancers tested; 0.09 % in 1962 central nervous system cancers tested.
Frequency of Mutated Sites:
None > 5 in 20,630 cancer specimens
Comments:
Only 1 deletion, 1 insertion and no complex mutations are noted on the COSMIC website.