
Nomenclature
Short Name:
FER
Full Name:
Proto-oncogene tyrosine-protein kinase FER
Alias:
- AV082135
- Kinase Fer
- P94-FER
- Phosphoprotein NCP94
- TYK3
- C-FER
- EC 2.7.10.2
- FER
- Fer (fps/fes related) tyrosine kinase
- FERT2
Classification
Type:
Protein-tyrosine kinase
Group:
TK
Family:
Fer
SubFamily:
NA

Specific Links
Structure
Mol. Mass (Da):
94,638
# Amino Acids:
822
# mRNA Isoforms:
3
mRNA Isoforms:
94,638 Da (822 AA; P16591); 74,266 Da (647 AA; P16591-2); 51,643 Da (453 AA; P16591-3)
4D Structure:
NA
1D Structure:
3D Image (rendered using PV Viewer):
PDB ID
Subfamily Alignment
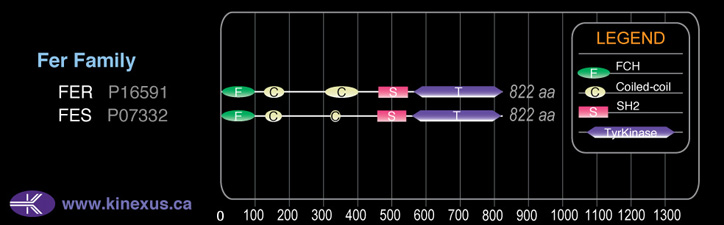
Domain Distribution:
| Start | End | Domain |
|---|---|---|
| 1 | 58 | FCH |
| 123 | 174 | Coiled-coil |
| 301 | 390 | Coiled-coil |
| 460 | 550 | SH2 |
| 563 | 814 | TyrKc |
| 563 | 816 | Pkinase |
Kinexus Products
Click on entries below for direct links to relevant products from Kinexus for this protein kinase.
hiddentext
Post-translation Modifications
For detailed information on phosphorylation of this kinase go to PhosphoNET
Acetylated:
K173, K326, K347, K795.
Serine phosphorylated:
S70, S113, S408, S411, S423, S427, S434, S498, S587, S715, S716.
Threonine phosphorylated:
T27, T410, T586, T592.
Tyrosine phosphorylated:
Y114, Y199, Y200, Y229, Y402, Y461, Y492, Y497, Y615+, Y714+, Y734.
Ubiquitinated:
K610, K720.
Distribution
Based on gene microarray analysis from the NCBI
Human Tissue Distribution
% Max Expression:
Mean Expression:
Number of Samples:
Standard Deviation:
% Max Expression:
Mean Expression:
Number of Samples:
Standard Deviation:
 32
32
939
16
1268
 0.5
0.5
15
13
20
 1
1
28
1
0
 12
12
352
55
828
 14
14
415
15
462
 3
3
95
44
199
 11
11
317
26
466
 33
33
956
28
2005
 7
7
189
13
240
 1.4
1.4
41
60
45
 0.4
0.4
11
22
9
 14
14
396
123
571
 0.4
0.4
12
12
6
 0.3
0.3
10
14
3
 0.5
0.5
15
18
16
 1
1
30
8
17
 0.3
0.3
10
264
10
 0.8
0.8
23
13
30
 0.4
0.4
13
52
13
 18
18
521
59
609
 0.5
0.5
14
19
10
 0.4
0.4
12
19
13
 0.5
0.5
14
2
10
 1.1
1.1
31
13
24
 0.3
0.3
10
17
7
 31
31
912
32
1465
 0.4
0.4
11
18
9
 0.3
0.3
8
11
8
 0.2
0.2
6
12
5
 2
2
62
14
44
 22
22
645
18
465
 100
100
2896
21
4849
 7
7
202
52
321
 28
28
816
26
680
 42
42
1224
22
914
Evolution
Species Conservation
PhosphoNET % Identity:
PhosphoNET % Similarity:
Homologene %
Identity:
PhosphoNET % Identity:
PhosphoNET % Similarity:
Homologene %
Identity:
 100
100
100
100 99.9
99.9
99.9
100 95.1
95.1
96.7
96 -
-
-
95 -
-
-
95 51.5
51.5
70.1
96 -
-
-
- 93
93
96.8
93 36.3
36.3
38
92 -
-
-
- 88.7
88.7
95.1
- 24.9
24.9
38.7
88 25.2
25.2
39.5
80 73.5
73.5
85.4
78 -
-
-
- 28.1
28.1
43.4
41 40
40
61.3
- -
-
-
41 -
-
-
- -
-
-
- -
-
-
- -
-
-
- -
-
-
- -
-
-
- -
-
-
-
For a wider analysis go to PhosphoNET Evolution in PhosphoNET
Regulation
Activation:
NA
Inhibition:
NA
Synthesis:
NA
Degradation:
NA
Known Upstream Kinases
For further details on these substrates click on the Substrate Short Name or UniProt ID. Phosphosite Location is hyperlinked to PhosphoNET
predictions.
Based on in vitro and/or in vivo phosphorylation data
| Kinase Short Name | UniProt ID (Human) | Phosphosite Location | Phosphosite Sequence | Effect of Phosphorylation |
|---|
Known Downstream Substrates
For further details on these substrates click on the Substrate Short Name or UniProt ID. Phosphosite Location is hyperlinked to PhosphoNET
predictions.
Based on in vitro and/or in vivo phosphorylation data
| Substrate Short Name | UniProt ID (Human) | Phosphosite Location | Phosphosite Sequence | Effect of Phosphorylation |
|---|
| Cortactin (CTTN) | Q14247 | Y421 | RLPSSPVYEDAASFK | |
| Cortactin (CTTN) | Q14247 | Y470 | AYATEAVYESAEAPG | |
| Cortactin (CTTN) | Q14247 | Y486 | YPAEDSTYDEYENDL | |
| CTNNB1 | P35222 | Y142 | AVVNLINYQDDAELA | |
| Desmoplakin 3 | P14923 | Y548 | AAGTQQPYTDGVRME | |
| FAK (PTK2) | Q05397 | Y577 | YMEDSTYYKASKGKL | + |
| FAK (PTK2) | Q05397 | Y861 | PIGNQHIYQPVGKPD | + |
| FAK (PTK2) | Q05397 | Y925 | DRSNDKVYENVTGLV | + |
| Fer | P16591 | Y615 | EAKILKQYDHPNIVK | + |
| Fer | P16591 | Y714 | RQEDGGVYSSSGLKQ | + |
| NSF | P46459 | Y83 | QEIEVSLYTFDKAKQ | |
| PECAM-1 | P16284 | Y690 | PLNSDVQYTEVQVSS | + |
| PECAM-1 | P16284 | Y713 | KKDTETVYSEVRKAV | + |
| PECAM-1 | P16284 | Y728 | PDAVESRYSRTEGSL | |
| PTP1B (PTPN1) | P18031 | Y152 | ISEDIKSYYTVRQLE | |
| STAT3 | P40763 | Y705 | DPGSAAPYLKTKFIC | + |
Protein Kinase Specificity
Matrix of observed frequency (%) of amino acids in aligned protein substrate phosphosites
Matrix Type:
Experimentally derived from alignment of 14 known protein substrate phosphosites and 59 peptides phosphorylated by recombinant Fer in vitro tested in-house by Kinexus.
Domain #:
1
Inhibitors
For further details on these inhibitors click on the Compound Name and enter it into DrugKiNET or click on the ID's
Based on in vitro and/or in vivo phosphorylation data
| Compound Name | KD, Ki or IC50 (nM) | PubChem ID | ChEMBL ID | PubMed ID |
|---|
Disease Linkage
General Disease Association:
Cancer, Infectious disease
Specific Diseases (Non-cancerous):
Encephalitis
Specific Cancer Types:
Sarcomas
Comments:
Fer is highly related in structure to Fes/Fps, which is an oncoprotein that was originally identified in chicken and cat retroviral-induced cancers.
Gene Expression in Cancers:
The COSMIC website notes an up-regulated expression score for FER in diverse human cancers of 398, which is 0.9-fold of the average score of 462 for the human protein kinases. The down-regulated expression score of 5 for this protein kinase in human cancers was 0.1-fold of the average score of 60 for the human protein kinases.
Mutagenesis Experiments:
Insertional mutagenesis studies in mice have not yet revealed a role for this protein kinase in mouse cancer oncogenesis. Mutations at amino acid residues 483 and 591 abrogate kinase phosphotransferase activity, and R483Q mutation can also lead to reduced location at microtubules.
Mutation Rate in All Cancers:
Percent mutation rates per 100 amino acids length in human cancers: 0.07 % in 24963 diverse cancer specimens. This rate is only -3 % lower and is very similar to the average rate of 0.075 % calculated for human protein kinases in general.
Mutation Rate in Specific Cancers:
Highest percent mutation rates per 100 amino acids length in human cancers: 0.49 % in 1093 large intestine cancers tested; 0.29 % in 589 stomach cancers tested; 0.2 % in 605 oesophagus cancers tested; 0.2 % in 602 endometrium cancers tested; 0.18 % in 854 skin cancers tested; 0.14 % in 1807 lung cancers tested.
Frequency of Mutated Sites:
None > 6 in 20,246 cancer specimens
Comments:
Nine deletions (7 at K476fs*53), 2 insertions (Q477fs*15), and no complex mutations noted on the COSMIC website. These deletions, insertions are located in the SH2 domain.