
Nomenclature
Short Name:
Fms
Full Name:
Macrophage colony stimulating factor I receptor
Alias:
- CD115
- Fms proto-oncogene
- Kinase CSFR
- Macrophage colony stimulating factor I receptor precursor
- M-CSFR
- Colony stimulating factor 1 receptor
- CSF1R
- CSF-1-R
- CSFMR
- FMS
Classification
Type:
Protein-tyrosine kinase
Group:
TK
Family:
PDGFR
SubFamily:
NA

Specific Links
Structure
Mol. Mass (Da):
107,984
# Amino Acids:
972
# mRNA Isoforms:
2
mRNA Isoforms:
107,984 Da (972 AA; P07333); 33,248 Da (306 AA; P07333-2)
4D Structure:
Interacts with INPPL1/SHIP2 and THOC5
1D Structure:
3D Image (rendered using PV Viewer):
PDB ID
Subfamily Alignment
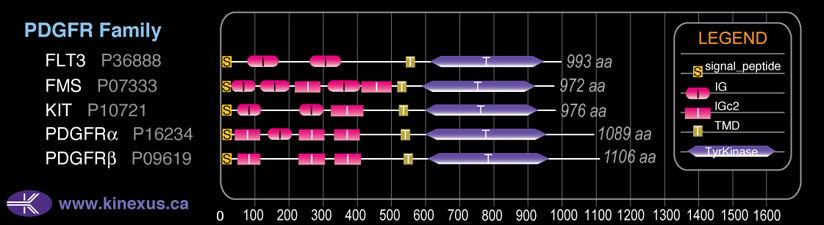
Domain Distribution:
Kinexus Products
Click on entries below for direct links to relevant products from Kinexus for this protein kinase.
hiddentext
Post-translation Modifications
For detailed information on phosphorylation of this kinase go to PhosphoNET
N-GlcNAcylated:
N45, N73, N153, N240, N275, N302, N335, N353, N412, N428, N480.
Serine phosphorylated:
S178, S555, S560, S686, S688, S713, S716+, S807+.
Threonine phosphorylated:
T363, T365, T562, T567.
Tyrosine phosphorylated:
Y546, Y556, Y561+, Y571, Y699+, Y708+, Y723-, Y809+, Y873, Y923+, Y969-.
Ubiquitinated:
K586, K812, K870.
Distribution
Based on gene microarray analysis from the NCBI
Human Tissue Distribution
% Max Expression:
Mean Expression:
Number of Samples:
Standard Deviation:
% Max Expression:
Mean Expression:
Number of Samples:
Standard Deviation:
 67
67
1273
16
1203
 9
9
164
8
76
 13
13
253
21
527
 29
29
552
72
650
 45
45
862
14
838
 43
43
820
53
1675
 17
17
328
19
509
 42
42
807
46
1934
 26
26
491
10
380
 5
5
97
42
66
 7
7
137
32
213
 39
39
755
113
720
 18
18
351
32
289
 3
3
66
6
58
 14
14
274
29
903
 24
24
465
7
291
 24
24
454
118
2807
 8
8
155
26
291
 8
8
158
57
363
 35
35
671
56
631
 24
24
463
28
387
 26
26
490
30
423
 9
9
172
30
223
 5
5
93
26
222
 9
9
176
28
331
 35
35
662
54
1272
 9
9
178
35
145
 10
10
200
26
249
 7
7
139
26
224
 13
13
249
14
105
 45
45
868
18
584
 100
100
1912
21
5164
 9
9
173
47
353
 64
64
1229
31
617
 7
7
138
22
99
Evolution
Species Conservation
PhosphoNET % Identity:
PhosphoNET % Similarity:
Homologene %
Identity:
PhosphoNET % Identity:
PhosphoNET % Similarity:
Homologene %
Identity:
 100
100
100
100 37.4
37.4
52.8
98 95.7
95.7
97.2
96 -
-
-
84 -
-
-
- 84.4
84.4
88.8
84.5 -
-
-
- 75.1
75.1
83.2
76 74.7
74.7
82.8
78 -
-
-
- 40.7
40.7
56.4
- 39.2
39.2
56.4
- 39.2
39.2
56.4
48 45
45
61.1
47 43.7
43.7
60.3
- -
-
-
- -
-
-
- -
-
-
- -
-
-
- -
-
-
- -
-
-
- -
-
-
- -
-
-
- -
-
-
- -
-
-
-
For a wider analysis go to PhosphoNET Evolution in PhosphoNET
Binding Proteins
Examples of known interacting proteins
hiddentext
| No. | Name – UniProt ID |
|---|---|
| 1 | CSF1 - P09603 |
| 2 | GRB2 - P62993 |
| 3 | SOCS1 - O15524 |
| 4 | THOC5 - Q13769 |
| 5 | INPP5D - Q92835 |
| 6 | CBL - P22681 |
| 7 | PIK3R1 - P27986 |
| 8 | SOS1 - Q07889 |
| 9 | GRAP2 - O75791 |
| 10 | SOCS3 - O14543 |
| 11 | PIK3R2 - O00459 |
| 12 | INPPL1 - O15357 |
| 13 | FYN - P06241 |
| 14 | YES1 - P07947 |
| 15 | SHC1 - P29353 |
Regulation
Activation:
Activated by binding of macrophage colony-stimulating factor 1 (CSF1), which induces dimerization and autophosphorylation..
Inhibition:
NA
Synthesis:
NA
Degradation:
NA
Known Upstream Kinases
For further details on these substrates click on the Substrate Short Name or UniProt ID. Phosphosite Location is hyperlinked to PhosphoNET
predictions.
Based on in vitro and/or in vivo phosphorylation data
| Kinase Short Name | UniProt ID (Human) | Phosphosite Location | Phosphosite Sequence | Effect of Phosphorylation |
|---|
Known Downstream Substrates
For further details on these substrates click on the Substrate Short Name or UniProt ID. Phosphosite Location is hyperlinked to PhosphoNET
predictions.
Based on in vitro and/or in vivo phosphorylation data
| Substrate Short Name | UniProt ID (Human) | Phosphosite Location | Phosphosite Sequence | Effect of Phosphorylation |
|---|
Protein Kinase Specificity
Matrix of observed frequency (%) of amino acids in aligned protein substrate phosphosites
Matrix Type:
Experimentally derived from alignment of 16 known protein substrate phosphosites and 100 peptides phosphorylated by recombinant FMS in vitro tested in-house by Kinexus.
Domain #:
1
Inhibitors
For further details on these inhibitors click on the Compound Name and enter it into DrugKiNET or click on the ID's
Based on in vitro and/or in vivo phosphorylation data
| Compound Name | KD, Ki or IC50 (nM) | PubChem ID | ChEMBL ID | PubMed ID |
|---|
Disease Linkage
General Disease Association:
Cancer, neurological disorders
Specific Diseases (Non-cancerous):
Hereditary diffuse leukoencephalopathy with spheroids; Malignant histiocytosis; Histiocytosis; Synovitis; 5q-syndrome; CSF1R-related hereditary diffuse leukoencephalopathy with spheroids; Pigmented villonodular synovitis; Villonodular synovitis
Comments:
In animal studies, mice lacking the Fms gene develop microglia in their brains derived from primitive myeloid progenitors expressing Runx1. Hereditary diffuse leukoencephalopathy with spheroids (HDLS) is a neurological disease characterized by cerebral white matter abnormalities in several brain regions. Common symptoms of HDLS are leukoencephalopathy (damage to the white matter of the brain), spheroids (swellings) in the axons of the brain neurons, and damaged myelin and axons. Malignant histiocytosis is a rare disease observed in humans and Bernese Mountain dogs, which is characterized by histiocytic (cells of the mononuclear phagocyte system) infiltration of the lymph nodes and lungs. In addition to the lungs and lymphatic system, the liver, spleen, and central nervous system can also be affected by the disease. Synovitis is a disease of the connective tissue characterized by inflammation of the synovial membrane that lines synovial joints. 5q-syndrome (chromosome 5 deletion syndrome) is a blood disease characterized by the loss of the long arm segment of chromosome 5 in myelocyte cells found in the bone marrow. A chromosomal break at 5q35 has been observed in several patients with malignant histiocytosis, indicating to affect Fms gene expression due to the proximity of the chromosomal break. In addtion, mutations in the Fms gene have been identified in patients with HDLS, associated with abnormalities in cerebral white matter, predominantly in the frontal and parietal lobes of the brain. These mutations include several substitution mutations (M875T, E633K, I794T, D837Y, A781E, R782H) as well as other forms of mutations (1754-2A-G, Ser688GlufsTer13, c.2442+1G-T). The majoirty of the mutations are found in the kinase domain of the Fms protein and are predicted to disrupt the kinase catalytic activity of the protein, as isolated mutant Fms proteins do not display autophosphorylation. In addition, mutant Fms proteins probably act as dominant-negatives due to the dimerization of the Fms proteins to form an active complex, thus heterozygosity for a mutant allele may be sufficient to compromise Fms function and contribute to the pathogenesis of HDLS.
Specific Cancer Types:
Sarcomas; Gastrointestinal stromal tumours; Lung cancer; Megakaryocytic leukemias; Histiocytic sarcoma; Acute myeloid leukemias (AML)
Comments:
Fms is a known oncoprotein (OP). Cancer-related mutations in human tumours point to a gain of function of the protein kinase. The active form of the protein kinase normally acts to promote tumour cell proliferation. Gain-of-function mutations in the Fms gene are associated with several forms of cancer. In patients with myelodysplastic and leukemic disorders, mutations were observed in codon 969 (12. 7%) and codon 301 (1. 8%) of the Fms gene. The tyrosine residue in the protein coded for by codon 969 has a negative regulatory function, which is eliminated by substitution mutations. Whereas, mutations at codon 301 lead to constitutive activation of the tyrosine kinase activity of the protein. In addition, significantly elevated expression of Fms has been observed in Hodgkin lymphoma specimens, correlated with the constitutive kinase catalytic activity of the Fms protein. This was predicted to be a result of the utilization of an alternative transcription start site in the Fms gene sequence, located ~6. 2 kb upstream of the normal transcription start site. In animal studies, mouse cancer cell lines (MOZ/TIF2-induced AML stem cells) with elevated Fms expression levels displayed an increased occurence of leukemia initiating activity as compared to cancer cells with a low level of Fms expression. In addition, treatment with drugs specific to Fms-expressing cells have been shown to eliminate leukemia for a period of up to 6 months in a leukemia mouse model with elevated expression levels of Fms in cancer cells.
Gene Expression in Cancers:
TranscriptoNET (www.transcriptonet.ca) analysis with mRNA expression data retrieved from the National Center for Biotechnology Information's Gene Expression Omnibus (GEO) database, which was normalized against 60 abundantly and commonly found proteins, indicated altered expression for this protein kinase as shown here as the percent change from normal tissue controls (%CFC) as supported with the Student T-test in the following types of human cancers: Brain glioblastomas (%CFC= -71, p<0.084); Brain oligodendrogliomas (%CFC= -79, p<0.061); Classical Hodgkin lymphomas (%CFC= +90, p<0.003); Clear cell renal cell carcinomas (cRCC) (%CFC= +216, p<0.0007); Colon mucosal cell adenomas (%CFC= -58, p<0.0001); Colorectal adenocarcinomas (early onset) (%CFC= +75, p<0.027); Large B-cell lymphomas (%CFC= +128, p<0.082); Ovary adenocarcinomas (%CFC= +78, p<0.025); Pituitary adenomas (ACTH-secreting) (%CFC= -53); and Vulvar intraepithelial neoplasia (%CFC= -45, p<0.027). The COSMIC website notes an up-regulated expression score for Fms in diverse human cancers of 276, which is 0.6-fold of the average score of 462 for the human protein kinases. The down-regulated expression score of 0 for this protein kinase in human cancers was 100% lower than the average score of 60 for the human protein kinases.
Mutagenesis Experiments:
Insertional mutagenesis studies in mice support a role for this protein kinase in mouse cancer oncogenesis.
Mutation Rate in All Cancers:
Percent mutation rates per 100 amino acids length in human cancers: 0.09 % in 27921 diverse cancer specimens. This rate is only 26 % higher than the average rate of 0.075 % calculated for human protein kinases in general.
Mutation Rate in Specific Cancers:
Highest percent mutation rates per 100 amino acids length in human cancers: 0.37 % in 1152 large intestine cancers tested; 0.31 % in 1042 skin cancers tested; 0.24 % in 589 stomach cancers tested; 0.15 % in 1943 lung cancers tested; 0.12 % in 3938 haematopoietic and lymphoid cancers tested; 0.1 % in 1284 liver cancers tested; 0.1 % in 1267 kidney cancers tested.
Frequency of Mutated Sites:
Most frequent mutations with the number of reports indicated in brackets: Y969C (13); Y969H (3); Y696F (3).
Comments:
Nine deletions, 2 insertions, and no complex mutations are noted on the COSMIC website. Six deletions are at E705 in the kinase catalytic domain.