
Nomenclature
Short Name:
GAK
Full Name:
Cyclin G-associated kinase
Alias:
- Cyclin G associated kinase
- EC 2.7.11.1
- Kinase GAK
Classification
Type:
Protein-serine/threonine kinase
Group:
Other
Family:
NAK
SubFamily:
NA

Structure
Mol. Mass (Da):
143,191
# Amino Acids:
1311
# mRNA Isoforms:
2
mRNA Isoforms:
143,191 Da (1311 AA; O14976); 134,464 Da (1232 AA; O14976-2)
4D Structure:
NA
1D Structure:
3D Image (rendered using PV Viewer):
PDB ID
Subfamily Alignment
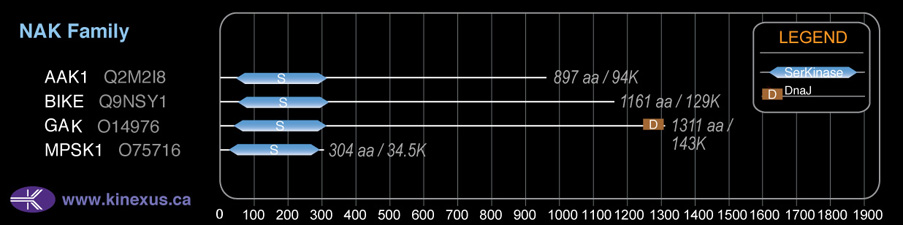
Domain Distribution:
| Start | End | Domain |
|---|---|---|
| 40 | 314 | Pkinase |
| 1247 | 1311 | DnaJ |
| 399 | 566 | Phosphatase tensin-type |
| 572 | 710 | C2 tensin-type |
| 1247 | 1311 | J |
Post-translation Modifications
For detailed information on phosphorylation of this kinase go to PhosphoNET
Acetylated:
K395.
Serine phosphorylated:
S16, S73, S277, S290, S340, S421, S456, S540, S770, S778, S780, S783, S785, S811, S812, S815, S817, S826, S829, S834, S837, S838, S939, S1096, S1118, S1130, S1154, S1176, S1185.
Threonine phosphorylated:
T776, T794, T805, T908, T1213.
Tyrosine phosphorylated:
Y153, Y201, Y204, Y235, Y276, Y285, Y338, Y367, Y371, Y403, Y615, Y764, Y1149.
Ubiquitinated:
K90, K175, K325, K390, K405, K432.
Distribution
Based on gene microarray analysis from the NCBI
Human Tissue Distribution
% Max Expression:
Mean Expression:
Number of Samples:
Standard Deviation:
% Max Expression:
Mean Expression:
Number of Samples:
Standard Deviation:
 48
48
755
42
837
 16
16
248
21
239
 16
16
245
29
243
 32
32
506
148
581
 61
61
952
33
671
 7
7
114
117
123
 34
34
523
47
539
 59
59
927
73
2023
 58
58
903
24
605
 16
16
255
138
227
 13
13
209
57
224
 49
49
762
259
679
 14
14
213
62
183
 14
14
218
16
217
 21
21
335
48
423
 12
12
195
23
189
 28
28
444
231
2971
 31
31
485
40
363
 6
6
100
157
112
 41
41
635
162
648
 15
15
236
46
252
 18
18
282
52
312
 20
20
308
32
288
 26
26
403
42
424
 23
23
360
45
369
 67
67
1046
96
1561
 15
15
235
65
199
 21
21
335
41
311
 15
15
240
42
197
 12
12
189
42
164
 60
60
943
30
961
 100
100
1561
51
2272
 11
11
169
51
156
 72
72
1119
78
854
 97
97
1513
48
1686
Evolution
Species Conservation
PhosphoNET % Identity:
PhosphoNET % Similarity:
Homologene %
Identity:
PhosphoNET % Identity:
PhosphoNET % Similarity:
Homologene %
Identity:
 100
100
100
100 99.6
99.6
99.8
100 88.6
88.6
89.2
97 -
-
-
82.5 -
-
-
87 47.8
47.8
52.2
85 -
-
-
- 82.6
82.6
88.5
83 82.4
82.4
88.3
83 -
-
-
- 74.2
74.2
83.3
- 70.2
70.2
80.3
72 -
-
-
69 66.7
66.7
78
74 -
-
-
- -
-
-
42 -
-
-
- -
-
-
- -
-
-
- -
-
-
- -
-
-
- -
-
-
- -
-
-
- -
-
-
- -
-
-
-
For a wider analysis go to PhosphoNET Evolution in PhosphoNET
Binding Proteins
Examples of known interacting proteins
hiddentext
| No. | Name – UniProt ID |
|---|---|
| 1 | AR - P10275 |
| 2 | CREBBP - Q92793 |
| 3 | HSPA8 - P11142 |
| 4 | CCNG1 - P51959 |
| 5 | CLTC - Q00610 |
| 6 | CDK5 - Q00535 |
| 7 | AP2M1 - Q96CW1 |
| 8 | AP1M1 - Q9BXS5 |
| 9 | AP1M2 - Q9Y6Q5 |
| 10 | ARHGAP4 - P98171 |
| 11 | USO1 - O60763 |
| 12 | IL12RB2 - Q99665 |
| 13 | DNM2 - P50570 |
| 14 | DNM1 - Q05193 |
| 15 | DNM3 - Q9UQ16 |
Regulation
Activation:
NA
Inhibition:
NA
Synthesis:
NA
Degradation:
NA
Protein Kinase Specificity
Matrix of observed frequency (%) of amino acids in aligned protein substrate phosphosites
Matrix Type:
Predicted from the application of the Kinexus Kinase Substrate Predictor Version 2.0 algorithm, which was trained with over 10,000 kinase-protein substrate pairs and 8,000 kinase-peptide substrate pairs.
Domain #:
1
Inhibitors
For further details on these inhibitors click on the Compound Name and enter it into DrugKiNET or click on the ID's
Based on in vitro and/or in vivo phosphorylation data
| Compound Name | KD, Ki or IC50 (nM) | PubChem ID | ChEMBL ID | PubMed ID |
|---|
Disease Linkage
General Disease Association:
Neurological disorders
Specific Diseases (Non-cancerous):
Parkinson's disease (PD)
Comments:
Parkinson's disease (PD) is a neurodegenerative movement disorder, characterized by the degeneration of the dopaminergic neurons in the substantia nigra of the midbrain. Symptoms of PD include trembling of hands, arms, legs, and face, stiffness in the arms and legs, bradykinesia, and poor coordination and balance. Based mainly on genome-wide association studies, GAK has been implicated as a suceptibility gene for the development of PD. In addition, a significant correlation was demonstrated between the rs1564282 allele of GAK and the risk for PD in a Taiwanese population, supporting a role for GAK in the pathogenesis of PD.
Gene Expression in Cancers:
TranscriptoNET (www.transcriptonet.ca) analysis with mRNA expression data retrieved from the National Center for Biotechnology Information's Gene Expression Omnibus (GEO) database, which was normalized against 60 abundantly and commonly found proteins, indicated altered expression for this protein kinase as shown here as the percent change from normal tissue controls (%CFC) as supported with the Student T-test in the following types of human cancers: Classical Hodgkin lymphomas (%CFC= +87, p<0.092); and Ovary adenocarcinomas (%CFC= +137, p<0.027). The COSMIC website notes an up-regulated expression score for GAK in diverse human cancers of 383, which is 0.8-fold of the average score of 462 for the human protein kinases. The down-regulated expression score of 259 for this protein kinase in human cancers was 4.3-fold of the average score of 60 for the human protein kinases.
Mutagenesis Experiments:
Insertional mutagenesis studies in mice support a role for this protein kinase in mouse cancer oncogenesis.
Mutation Rate in All Cancers:
Percent mutation rates per 100 amino acids length in human cancers: 0.06 % in 24977 diverse cancer specimens. This rate is only -14 % lower than the average rate of 0.075 % calculated for human protein kinases in general.
Mutation Rate in Specific Cancers:
Highest percent mutation rates per 100 amino acids length in human cancers: 0.29 % in 1093 large intestine cancers tested; 0.28 % in 805 skin cancers tested; 0.23 % in 589 stomach cancers tested; 0.18 % in 602 endometrium cancers tested; 0.17 % in 500 urinary tract cancers tested; 0.13 % in 1807 lung cancers tested.
Frequency of Mutated Sites:
None > 2 in 20,244 cancer specimens
Comments:
Only 6 deletions, 1 insertion and no complex mutations are noted on the COSMIC website.