
Nomenclature
Short Name:
GCN2
Full Name:
Eukaryotic translation initiation factor 2-alpha kinase 4
Alias:
- E2AK4
- EC 2.7.11.1
- EIF2AK4
- GCN2-like protein
- KIAA1338
- DKFZP434P061
Classification
Type:
Protein-serine/threonine kinase
Group:
Other
Family:
PEK
SubFamily:
GCN2

Specific Links
Structure
Mol. Mass (Da):
186911
# Amino Acids:
1649
# mRNA Isoforms:
3
mRNA Isoforms:
186,911 Da (1649 AA; Q9P2K8); 183,717 Da (1621 AA; Q9P2K8-2); 69,797 Da (616 AA; Q9P2K8-3)
4D Structure:
NA
1D Structure:
3D Image (rendered using PV Viewer):
PDB ID
Subfamily Alignment
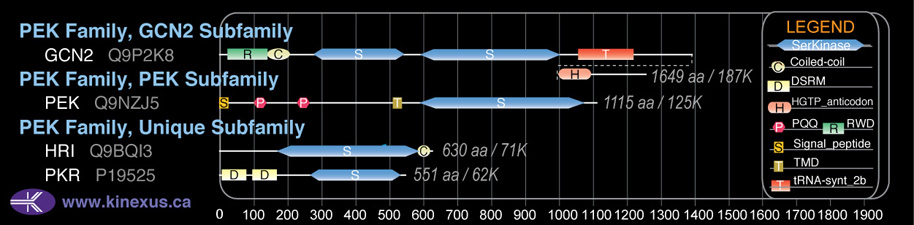
Domain Distribution:
| Start | End | Domain |
|---|---|---|
| 25 | 137 | RWD |
| 146 | 205 | Coiled-coil |
| 590 | 1001 | Pkinase |
| 590 | 1001 | Pkinase |
| 1059 | 1223 | tRNA-synt_2b |
| 1398 | 1489 | HGTP_anticodon |
Kinexus Products
Click on entries below for direct links to relevant products from Kinexus for this protein kinase.
hiddentext
Post-translation Modifications
For detailed information on phosphorylation of this kinase go to PhosphoNET
Acetylated:
K606, K1259, .
Serine phosphorylated:
S102, S207, S230, S254, S261, S467, S551, S555, S572, S672, S770, S928.
Threonine phosphorylated:
T667, T871, T899, T991, T1085.
Tyrosine phosphorylated:
Y253, Y269, Y500, Y560.
Distribution
Based on gene microarray analysis from the NCBI
Human Tissue Distribution
% Max Expression:
Mean Expression:
Number of Samples:
Standard Deviation:
% Max Expression:
Mean Expression:
Number of Samples:
Standard Deviation:
 94
94
1654
15
1142
 13
13
221
4
219
 -
-
-
-
-
 10
10
178
56
309
 40
40
705
20
549
 2
2
42
18
39
 2
2
36
20
29
 70
70
1231
10
1777
 -
-
-
-
-
 5
5
96
54
120
 9
9
159
6
224
 51
51
904
18
562
 23
23
413
2
184
 30
30
535
2
529
 17
17
301
6
407
 12
12
204
12
381
 14
14
249
75
269
 31
31
546
2
85
 4
4
77
38
82
 45
45
792
58
553
 19
19
338
6
375
 7
7
119
4
111
 -
-
-
-
-
 38
38
672
4
279
 10
10
170
6
164
 38
38
668
38
529
 17
17
305
2
150
 18
18
321
2
301
 65
65
1153
2
557
 4
4
68
28
58
 100
100
1766
12
87
 4
4
73
18
70
 36
36
641
55
920
 43
43
766
52
639
 3
3
54
26
33
Evolution
Species Conservation
PhosphoNET % Identity:
PhosphoNET % Similarity:
Homologene %
Identity:
PhosphoNET % Identity:
PhosphoNET % Similarity:
Homologene %
Identity:
 100
100
100
100 99.8
99.8
99.9
100 -
-
-
99 -
-
-
94 -
-
-
94 89.7
89.7
94.3
91 -
-
-
- 90.5
90.5
94.9
90.5 -
-
-
91 -
-
-
- 74.7
74.7
84.4
- 72.3
72.3
84.5
73.5 -
-
-
69 52.6
52.6
67.4
63 -
-
-
- -
-
-
36 27.9
27.9
44
- -
-
-
32 40.4
40.4
59.4
- -
-
-
- -
-
-
- -
-
-
28 22.5
22.5
39.7
26 26.2
26.2
46.3
32 -
-
-
32.5
For a wider analysis go to PhosphoNET Evolution in PhosphoNET
Binding Proteins
Examples of known interacting proteins
hiddentext
| No. | Name – UniProt ID |
|---|---|
| 1 | SMAD4 - Q13485 |
| 2 | SMAD1 - Q15797 |
| 3 | TGFBR1 - P36897 |
| 4 | EIF2S1 - P05198 |
| 5 | EIF2B4 - Q9UI10 |
| 6 | EIF2B2 - P49770 |
| 7 | GCN1L1 - Q92616 |
Regulation
Activation:
NA
Inhibition:
NA
Synthesis:
NA
Degradation:
NA
Known Downstream Substrates
For further details on these substrates click on the Substrate Short Name or UniProt ID. Phosphosite Location is hyperlinked to PhosphoNET
predictions.
Based on in vitro and/or in vivo phosphorylation data
| Substrate Short Name | UniProt ID (Human) | Phosphosite Location | Phosphosite Sequence | Effect of Phosphorylation |
|---|
Protein Kinase Specificity
Matrix of observed frequency (%) of amino acids in aligned protein substrate phosphosites
Matrix Type:
Predicted from the application of the Kinexus Kinase Substrate Predictor Version 2.0 algorithm, which was trained with over 10,000 kinase-protein substrate pairs and 8,000 kinase-peptide substrate pairs. Note that GCN2 has a strong preference for phosphorylation of eIF2A due to additional binding sites for this substrate. This additional selectivity in binding eIF2A appear to arise from the Gap 3 and Gap 4 insert regions in the catalytic domain of the protein kinase between Subdomains IV and VI.
Domain #:
1
Inhibitors
For further details on these inhibitors click on the Compound Name and enter it into DrugKiNET or click on the ID's
Based on in vitro and/or in vivo phosphorylation data
| Compound Name | KD, Ki or IC50 (nM) | PubChem ID | ChEMBL ID | PubMed ID |
|---|
Disease Linkage
General Disease Association:
Pulmonary disorders, and infectious diseases
Specific Diseases (Non-cancerous):
Pulmonary venoocclusive disease 2 (PVOD2); Pulmonary venoocclusive disease; Yellow fever
Comments:
R585Q and L643R mutations in GCN2 are associated with pulmonary veno occlusive disease 2, autosomal recessive, which is a disease characterized by fibrous obstruction, and intimal thickening of septal veins and preseptal venules.
Gene Expression in Cancers:
The COSMIC website notes an up-regulated expression score for GCN2 in diverse human cancers of 329, which is 0.7-fold of the average score of 462 for the human protein kinases. The down-regulated expression score of 197 for this protein kinase in human cancers was 3.3-fold of the average score of 60 for the human protein kinases.
Mutagenesis Experiments:
Insertional mutagenesis studies in mice have not yet revealed a role for this protein kinase in mouse cancer oncogenesis.
Mutation Rate in All Cancers:
Percent mutation rates per 100 amino acids length in human cancers: 0.05 % in 24782 diverse cancer specimens. This rate is only -30 % lower than the average rate of 0.075 % calculated for human protein kinases in general.
Mutation Rate in Specific Cancers:
Highest percent mutation rates per 100 amino acids length in human cancers: 0.21 % in 1270 large intestine cancers tested; 0.2 % in 864 skin cancers tested; 0.18 % in 589 stomach cancers tested; 0.12 % in 603 endometrium cancers tested; 0.1 % in 548 urinary tract cancers tested; 0.08 % in 1512 liver cancers tested; 0.07 % in 1634 lung cancers tested; 0.06 % in 942 upper aerodigestive tract cancers tested; 0.05 % in 1316 breast cancers tested; 0.05 % in 1276 kidney cancers tested; 0.04 % in 833 ovary cancers tested; 0.01 % in 1459 pancreas cancers tested.
Frequency of Mutated Sites:
Most frequent mutations with the number of reports indicated in brackets: I340F (4); R465C (4);L1083V (4).
Comments:
Nine deletions, 16 insertions (at D737) and no complex mutations are noted on the COSMIC website.