
Nomenclature
Short Name:
HIPK1
Full Name:
Homeodomain-interacting protein kinase 1
Alias:
- HIK1
- Myak
- Nbak2
- Homeodomain interacting protein kinase 1
- KIAA0630
- MGC26642
- MGC33446
- MGC33548
Classification
Type:
Protein-serine/threonine kinase
Group:
CMGC
Family:
DYRK
SubFamily:
HIPK

Specific Links
Structure
Mol. Mass (Da):
130,843
# Amino Acids:
1210
# mRNA Isoforms:
4
mRNA Isoforms:
130,843 Da (1210 AA; Q86Z02); 116,731 Da (1075 AA; Q86Z02-2); 89,481 Da (836 AA; Q86Z02-3); 87,302 Da (816 AA; Q86Z02-4)
4D Structure:
Interacts with Nkx1-2 and Nkx2-5 By similarity. Interacts with DAXX and TP53
1D Structure:
Subfamily Alignment
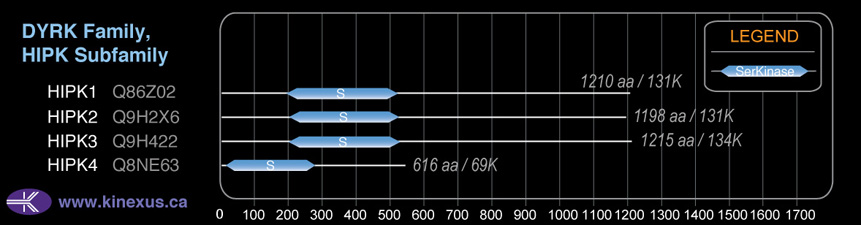
Domain Distribution:
| Start | End | Domain |
|---|---|---|
| 190 | 518 | Pkinase |
Kinexus Products
Click on entries below for direct links to relevant products from Kinexus for this protein kinase.
hiddentext
Post-translation Modifications
For detailed information on phosphorylation of this kinase go to PhosphoNET
Serine phosphorylated:
S29, S34, S37, S38, S127, S350, S355-, S854, S872, S878, S879, S967, S1063, S1200.
Threonine phosphorylated:
T351, T876, T1027, T1202.
Tyrosine phosphorylated:
Y352, Y357, Y358, Y1197.
Ubiquitinated:
K421, K440, K452, K855, K928.
Distribution
Based on gene microarray analysis from the NCBI
Human Tissue Distribution
% Max Expression:
Mean Expression:
Number of Samples:
Standard Deviation:
% Max Expression:
Mean Expression:
Number of Samples:
Standard Deviation:
 24
24
1143
41
979
 3
3
157
17
94
 3
3
147
2
120
 7
7
343
131
496
 19
19
895
36
602
 2
2
97
99
73
 4
4
184
51
403
 29
29
1369
35
2747
 16
16
765
17
608
 2
2
108
73
64
 2
2
80
21
68
 19
19
867
165
709
 2
2
108
24
66
 2
2
106
12
98
 2
2
103
15
90
 3
3
147
25
111
 20
20
954
122
4853
 1.1
1.1
52
11
49
 3
3
149
77
128
 17
17
788
155
717
 3
3
135
13
118
 3
3
137
17
105
 2
2
105
4
51
 4
4
207
11
102
 7
7
335
13
298
 20
20
929
83
860
 2
2
95
27
59
 3
3
122
11
78
 2
2
106
11
67
 6
6
303
28
174
 10
10
473
48
187
 100
100
4675
48
9685
 5
5
217
97
416
 19
19
885
104
705
 28
28
1292
88
2363
Evolution
Species Conservation
PhosphoNET % Identity:
PhosphoNET % Similarity:
Homologene %
Identity:
PhosphoNET % Identity:
PhosphoNET % Similarity:
Homologene %
Identity:
 100
100
100
100 99.8
99.8
99.9
100 99.4
99.4
99.5
99 -
-
-
98.5 -
-
-
99 98.3
98.3
99
98 -
-
-
- 97.6
97.6
98.8
98 97.2
97.2
98.4
97 -
-
-
- -
-
-
- -
-
-
90 22.8
22.8
35.5
85 -
-
-
- -
-
-
- 22.7
22.7
36.9
- -
-
-
- -
-
-
- -
-
-
- -
-
-
- -
-
-
- -
-
-
- -
-
-
- -
-
-
- -
-
-
-
For a wider analysis go to PhosphoNET Evolution in PhosphoNET
Binding Proteins
Examples of known interacting proteins
hiddentext
| No. | Name – UniProt ID |
|---|---|
| 1 | TP53 - P04637 |
| 2 | NKX2-5 - P52952 |
| 3 | HOXD4 - P09016 |
| 4 | SNIP1 - Q8TAD8 |
Regulation
Activation:
NA
Inhibition:
NA
Synthesis:
NA
Degradation:
NA
Protein Kinase Specificity
Matrix of observed frequency (%) of amino acids in aligned protein substrate phosphosites
Matrix Type:
Derived from alignment of 35 peptides phosphorylated by recombinant HIPK1 in vitro tested in-house by Kinexus.
Domain #:
1
Inhibitors
For further details on these inhibitors click on the Compound Name and enter it into DrugKiNET or click on the ID's
Based on in vitro and/or in vivo phosphorylation data
| Compound Name | KD, Ki or IC50 (nM) | PubChem ID | ChEMBL ID | PubMed ID |
|---|
Disease Linkage
General Disease Association:
Cancer
Specific Cancer Types:
Colorectal cancer (CRC)
Comments:
HIPK1 may be a tumour suppressor protein (TSP). Over-expression of HIPK1 has been observed in colorectal cancer specimens, with highest levels at the beginning of tumorigenesis followed by a progressive reduction over time as the cancer develops, indicating a role for the HIPK1 protein in the early events of tumorigenesis. in addition, these specimens also displayed native p53 and normal levels of p21, indicating that the HIPK1 protein functions as a tumour suppressor and that a loss-of-function in the protein is associated with tumorigenesis.
Gene Expression in Cancers:
TranscriptoNET (www.transcriptonet.ca) analysis with mRNA expression data retrieved from the National Center for Biotechnology Information's Gene Expression Omnibus (GEO) database, which was normalized against 60 abundantly and commonly found proteins, indicated altered expression for this protein kinase as shown here as the percent change from normal tissue controls (%CFC) as supported with the Student T-test in the following types of human cancers: Bladder carcinomas (%CFC= +77, p<(0.0003); and Cervical cancer stage 1B (%CFC= +76, p<0.078). The COSMIC website notes an up-regulated expression score for HIPK1 in diverse human cancers of 282, which is 0.6-fold of the average score of 462 for the human protein kinases. The down-regulated expression score of 114 for this protein kinase in human cancers was 1.9-fold of the average score of 60 for the human protein kinases.
Mutagenesis Experiments:
Insertional mutagenesis studies in mice support a role for this protein kinase in mouse cancer oncogenesis.
Mutation Rate in All Cancers:
Percent mutation rates per 100 amino acids length in human cancers: 0.06 % in 24752 diverse cancer specimens. This rate is only -26 % lower than the average rate of 0.075 % calculated for human protein kinases in general.
Mutation Rate in Specific Cancers:
Highest percent mutation rates per 100 amino acids length in human cancers: 0.23 % in 603 endometrium cancers tested; 0.23 % in 1229 large intestine cancers tested; 0.19 % in 864 skin cancers tested; 0.14 % in 1609 lung cancers tested; 0.13 % in 555 stomach cancers tested; 0.11 % in 548 urinary tract cancers tested; 0.09 % in 1512 liver cancers tested; 0.08 % in 710 oesophagus cancers tested; 0.06 % in 273 cervix cancers tested; 0.04 % in 881 prostate cancers tested; 0.04 % in 2082 central nervous system cancers tested; 0.03 % in 1316 breast cancers tested; 0.03 % in 1253 kidney cancers tested; 0.02 % in 942 upper aerodigestive tract cancers tested; 0.02 % in 807 ovary cancers tested; 0.02 % in 1437 pancreas cancers tested; 0.01 % in 558 thyroid cancers tested; 0.01 % in 1982 haematopoietic and lymphoid cancers tested.
Frequency of Mutated Sites:
None > 4 in 20,037 cancer specimens
Comments:
Only 6 deletions, 2 insertions and no complex mutations are noted on the COSMIC website.