
Nomenclature
Short Name:
HIPK3
Full Name:
Homeodomain-interacting protein kinase 3
Alias:
- DJ8L15.1
- YAK1
- DYRK6
- EC 2.7.11.1
- FIST3
- PKY
Classification
Type:
Protein-serine/threonine kinase
Group:
CMGC
Family:
DYRK
SubFamily:
HIPK

Structure
Mol. Mass (Da):
133743
# Amino Acids:
1215
# mRNA Isoforms:
2
mRNA Isoforms:
133,743 Da (1215 AA; Q9H422); 131,256 Da (1194 AA; Q9H422-2)
4D Structure:
Interacts with Nkx1-2. Interacts with FAS and DAXX. Probably part of a complex consisting of HIPK3, FAS and FADD. Interacts with and stabilizes ligand-bound androgen receptor (AR) By similarity. Interacts with UBL1/SUMO-1.
1D Structure:
Subfamily Alignment
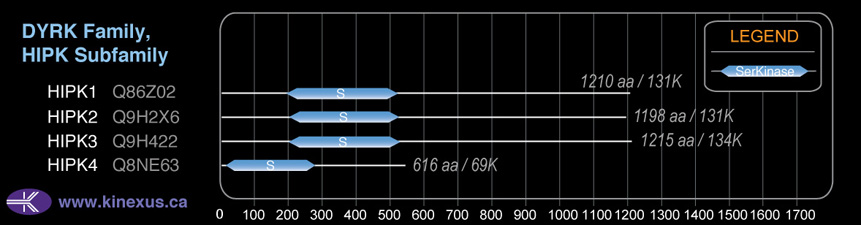
Domain Distribution:
| Start | End | Domain |
|---|---|---|
| 197 | 525 | Pkinase |
Kinexus Products
Click on entries below for direct links to relevant products from Kinexus for this protein kinase.
hiddentext
Post-translation Modifications
For detailed information on phosphorylation of this kinase go to PhosphoNET
Serine phosphorylated:
S357, S362-, S1205.
Threonine phosphorylated:
T156, T219, T358.
Tyrosine phosphorylated:
Y8, Y359, Y466.
Ubiquitinated:
K428, K459.
Distribution
Based on gene microarray analysis from the NCBI
Human Tissue Distribution
% Max Expression:
Mean Expression:
Number of Samples:
Standard Deviation:
% Max Expression:
Mean Expression:
Number of Samples:
Standard Deviation:
 100
100
1185
42
1769
 2
2
25
24
28
 55
55
646
18
616
 20
20
232
137
442
 37
37
434
36
420
 2
2
20
118
44
 24
24
283
51
492
 53
53
629
62
707
 22
22
256
24
184
 10
10
116
144
217
 7
7
87
50
111
 42
42
503
271
530
 10
10
114
51
195
 4
4
42
21
36
 11
11
135
40
195
 2
2
29
24
24
 5
5
55
307
164
 26
26
306
33
415
 21
21
247
145
592
 30
30
361
162
459
 13
13
153
39
240
 18
18
209
45
354
 24
24
281
29
418
 22
22
262
33
363
 10
10
122
39
159
 47
47
555
85
728
 16
16
187
54
365
 13
13
155
33
204
 35
35
417
33
641
 5
5
56
42
57
 26
26
303
30
278
 38
38
454
51
413
 6
6
74
91
129
 54
54
635
83
560
 29
29
342
48
518
Evolution
Species Conservation
PhosphoNET % Identity:
PhosphoNET % Similarity:
Homologene %
Identity:
PhosphoNET % Identity:
PhosphoNET % Similarity:
Homologene %
Identity:
 100
100
100
100 99.7
99.7
99.8
100 97.9
97.9
98.5
98 -
-
-
95 -
-
-
- 95.5
95.5
97.9
95.5 -
-
-
- 89
89
93.1
91 88.9
88.9
92.6
91 -
-
-
- 84.9
84.9
90.2
- 80.3
80.3
86.7
82 23
23
34.4
71 61.7
61.7
74.1
67 -
-
-
- -
-
-
- -
-
-
- -
-
-
51 -
-
-
- -
-
-
- -
-
-
- -
-
-
- -
-
-
- -
-
-
- -
-
-
-
For a wider analysis go to PhosphoNET Evolution in PhosphoNET
Binding Proteins
Examples of known interacting proteins
hiddentext
| No. | Name – UniProt ID |
|---|---|
| 1 | FADD - Q13158 |
| 2 | FAS - P25445 |
| 3 | DAXX - Q9UER7 |
| 4 | AR - P10275 |
| 5 | SUMO1 - P63165 |
| 6 | TP53 - P04637 |
| 7 | TP73 - O15350 |
| 8 | HEYL - Q9NQ87 |
| 9 | EIF2AK2 - P19525 |
| 10 | ARRB2 - P32121 |
| 11 | TOX4 - O94842 |
| 12 | FLNC - Q14315 |
| 13 | RGS3 - P49796 |
| 14 | C1QA - P02745 |
| 15 | TGFB1I1 - O43294 |
Regulation
Activation:
NA
Inhibition:
NA
Synthesis:
NA
Degradation:
NA
Protein Kinase Specificity
Matrix of observed frequency (%) of amino acids in aligned protein substrate phosphosites
Matrix Type:
Derived from alignment of 30 peptides phosphorylated by recombinant HIPK3 in vitro tested in-house by Kinexus.
Domain #:
1
Inhibitors
For further details on these inhibitors click on the Compound Name and enter it into DrugKiNET or click on the ID's
Based on in vitro and/or in vivo phosphorylation data
| Compound Name | KD, Ki or IC50 (nM) | PubChem ID | ChEMBL ID | PubMed ID |
|---|
Disease Linkage
Gene Expression in Cancers:
TranscriptoNET (www.transcriptonet.ca) analysis with mRNA expression data retrieved from the National Center for Biotechnology Information's Gene Expression Omnibus (GEO) database, which was normalized against 60 abundantly and commonly found proteins, indicated altered expression for this protein kinase as shown here as the percent change from normal tissue controls (%CFC) as supported with the Student T-test in the following types of human cancers: Barrett's esophagus epithelial metaplasia (%CFC= -53, p<0.0002); Cervical cancer stage 1B (%CFC= +160, p<0.019); Cervical cancer stage 2B (%CFC= +320, p<0.053); and Uterine leiomyomas from fibroids (%CFC= -54, p<0.004). The COSMIC website notes an up-regulated expression score for HIPK3 in diverse human cancers of 317, which is 0.7-fold of the average score of 462 for the human protein kinases. The down-regulated expression score of 17 for this protein kinase in human cancers was 0.3-fold of the average score of 60 for the human protein kinases.
Mutagenesis Experiments:
Insertional mutagenesis studies in mice support a role for this protein kinase in mouse cancer oncogenesis. A K226R mutation can contribute to loss of phosphotransferase activity and impaired activation of SF1.
Mutation Rate in All Cancers:
Percent mutation rates per 100 amino acids length in human cancers: 0.05 % in 24817 diverse cancer specimens. This rate is only -30 % lower than the average rate of 0.075 % calculated for human protein kinases in general.
Mutation Rate in Specific Cancers:
Highest percent mutation rates per 100 amino acids length in human cancers: 0.24 % in 589 stomach cancers tested; 0.22 % in 603 endometrium cancers tested; 0.21 % in 1270 large intestine cancers tested; 0.14 % in 548 urinary tract cancers tested; 0.11 % in 864 skin cancers tested; 0.09 % in 1512 liver cancers tested; 0.08 % in 1635 lung cancers tested; 0.06 % in 710 oesophagus cancers tested; 0.04 % in 881 prostate cancers tested; 0.04 % in 1364 kidney cancers tested; 0.04 % in 1316 breast cancers tested; 0.03 % in 833 ovary cancers tested; 0.02 % in 942 upper aerodigestive tract cancers tested; 0.02 % in 2011 haematopoietic and lymphoid cancers tested; 0.02 % in 1459 pancreas cancers tested; 0.01 % in 2082 central nervous system cancers tested.
Frequency of Mutated Sites:
Most frequent mutations with the number of reports indicated in brackets: A140T (4).
Comments:
Only 1 deletion, 2 insertions and 1 complex mutations are noted on the COSMIC website.