
Nomenclature
Short Name:
HIPK4
Full Name:
Homeodomain interacting protein kinase 4
Alias:
- BG105231
- FLJ32818
Classification
Type:
Protein-serine/threonine kinase
Group:
CMGC
Family:
DYRK
SubFamily:
HIPK

Structure
Mol. Mass (Da):
69,425
# Amino Acids:
616
# mRNA Isoforms:
1
mRNA Isoforms:
69,425 Da (616 AA; Q8NE63)
4D Structure:
NA
1D Structure:
Subfamily Alignment
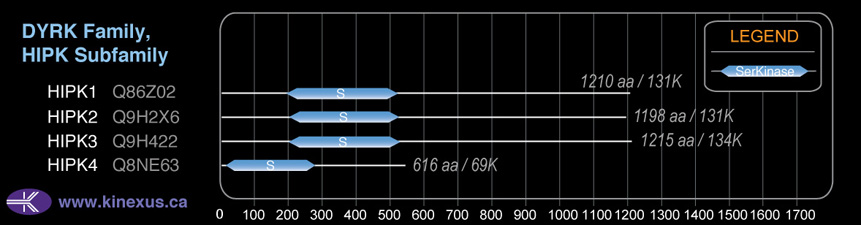
Domain Distribution:
| Start | End | Domain |
|---|---|---|
| 11 | 347 | Pkinase |
Kinexus Products
Click on entries below for direct links to relevant products from Kinexus for this protein kinase.
hiddentext
Post-translation Modifications
For detailed information on phosphorylation of this kinase go to PhosphoNET
Acetylated:
K19, K27.
Serine phosphorylated:
S301.
Threonine phosphorylated:
T122, T381, T390+.
Tyrosine phosphorylated:
Y175+, Y392, Y393.
Distribution
Based on gene microarray analysis from the NCBI
Human Tissue Distribution
% Max Expression:
Mean Expression:
Number of Samples:
Standard Deviation:
% Max Expression:
Mean Expression:
Number of Samples:
Standard Deviation:
 100
100
2218
6
984
 0.8
0.8
18
4
5
 -
-
-
-
-
 3
3
60
28
77
 30
30
676
10
466
 0.7
0.7
16
9
9
 0.5
0.5
12
13
11
 6
6
129
5
150
 0.4
0.4
9
3
1
 9
9
198
5
314
 5
5
115
5
148
 35
35
786
11
657
 -
-
-
-
-
 0.1
0.1
3
3
1
 6
6
127
5
172
 2
2
36
5
7
 5
5
102
9
183
 1
1
26
3
1
 0.7
0.7
15
3
1
 23
23
507
26
241
 5
5
113
5
137
 5
5
120
5
163
 -
-
-
-
-
 0.9
0.9
19
3
4
 5
5
116
5
151
 29
29
649
19
577
 0.4
0.4
8
3
2
 3
3
67
3
8
 0.5
0.5
10
3
2
 -
-
-
-
-
 25
25
544
12
43
 8
8
174
5
16
 0.2
0.2
4
12
0
 40
40
888
26
765
 19
19
412
22
261
Evolution
Species Conservation
PhosphoNET % Identity:
PhosphoNET % Similarity:
Homologene %
Identity:
PhosphoNET % Identity:
PhosphoNET % Similarity:
Homologene %
Identity:
 100
100
100
100 98.2
98.2
98.8
98 97.4
97.4
98
- -
-
-
88 -
-
-
- 89.4
89.4
91.7
90 -
-
-
- 87.1
87.1
90
87 86.5
86.5
89.9
87 -
-
-
- 47.8
47.8
53.7
- -
-
-
- -
-
-
- 23.1
23.1
34.2
- -
-
-
- -
-
-
- -
-
-
- -
-
-
- -
-
-
- -
-
-
- -
-
-
- -
-
-
- -
-
-
- -
-
-
- -
-
-
-
For a wider analysis go to PhosphoNET Evolution in PhosphoNET
Regulation
Activation:
NA
Inhibition:
NA
Synthesis:
NA
Degradation:
NA
Known Downstream Substrates
For further details on these substrates click on the Substrate Short Name or UniProt ID. Phosphosite Location is hyperlinked to PhosphoNET
predictions.
Based on in vitro and/or in vivo phosphorylation data
| Substrate Short Name | UniProt ID (Human) | Phosphosite Location | Phosphosite Sequence | Effect of Phosphorylation |
|---|
| p53 (TP53) | P04637 | S9 | EEPQSDPSVEPPLSQ |
Protein Kinase Specificity
Matrix of observed frequency (%) of amino acids in aligned protein substrate phosphosites
Matrix Type:
Derived from alignment of 30 peptides phosphorylated by recombinant HIPK4 in vitro tested in-house by Kinexus.
Domain #:
1
Inhibitors
For further details on these inhibitors click on the Compound Name and enter it into DrugKiNET or click on the ID's
Based on in vitro and/or in vivo phosphorylation data
| Compound Name | KD, Ki or IC50 (nM) | PubChem ID | ChEMBL ID | PubMed ID |
|---|
Disease Linkage
Gene Expression in Cancers:
The COSMIC website notes an up-regulated expression score for HIPK4 in diverse human cancers of 392, which is 0.9-fold of the average score of 462 for the human protein kinases. The down-regulated expression score of 0 for this protein kinase in human cancers was 100% lower than the average score of 60 for the human protein kinases.
Mutagenesis Experiments:
Insertional mutagenesis studies in mice have not yet revealed a role for this protein kinase in mouse cancer oncogenesis.
Mutation Rate in All Cancers:
Percent mutation rates per 100 amino acids length in human cancers: 0.06 % in 24726 diverse cancer specimens. This rate is only -15 % lower than the average rate of 0.075 % calculated for human protein kinases in general.
Mutation Rate in Specific Cancers:
Highest percent mutation rates per 100 amino acids length in human cancers: 0.28 % in 864 skin cancers tested; 0.28 % in 589 stomach cancers tested; 0.24 % in 603 endometrium cancers tested; 0.21 % in 548 urinary tract cancers tested; 0.19 % in 1270 large intestine cancers tested; 0.18 % in 273 cervix cancers tested; 0.08 % in 1634 lung cancers tested; 0.08 % in 1459 pancreas cancers tested; 0.07 % in 881 prostate cancers tested; 0.07 % in 238 bone cancers tested; 0.05 % in 710 oesophagus cancers tested; 0.05 % in 2082 central nervous system cancers tested; 0.04 % in 1316 breast cancers tested; 0.03 % in 942 upper aerodigestive tract cancers tested; 0.03 % in 1512 liver cancers tested; 0.02 % in 833 ovary cancers tested.
Frequency of Mutated Sites:
Most frequent mutations with the number of reports indicated in brackets: R278C (3).
Comments:
Only 2 deletions, and no insertions or complex mutations are noted on the COSMIC website.