
Nomenclature
Short Name:
HSER
Full Name:
Heat-stable enterotoxin receptor
Alias:
- EC 4.6.1.2
- STa receptor
- STaR
- GC-C
- GUC2C
- GUCY2C
- Intestinal guanylate cyclase
Classification
Type:
Protein-serine/threonine kinase
Group:
RGC
Family:
RGC
SubFamily:
NA

Structure
Mol. Mass (Da):
123,369
# Amino Acids:
1073
# mRNA Isoforms:
1
mRNA Isoforms:
123,403 Da (1073 AA; P25092)
4D Structure:
Interacts via its C-terminal region with PDZK2
1D Structure:
Subfamily Alignment
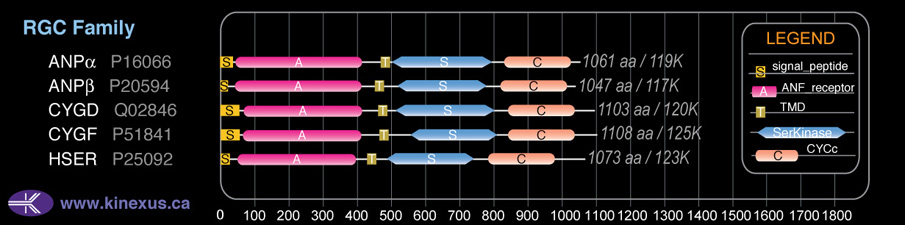
Domain Distribution:
| Start | End | Domain |
|---|---|---|
| 1 | 20 | signal_peptide |
| 53 | 386 | ANF_receptor |
| 432 | 454 | TMD |
| 489 | 749 | Pkinase |
| 788 | 983 | CYCc |
| 824 | 954 | Guanylate cyclase |
Post-translation Modifications
For detailed information on phosphorylation of this kinase go to PhosphoNET
Acetylated:
K516.
Methylated:
K1054.
N-GlcNAcylated:
N32, N75, N79, N195, N284, N307, N345, N357, N402.
Serine phosphorylated:
S665, S965, S1052+.
Threonine phosphorylated:
T189, T396, T399, T404, T414, T440, T1001.
Tyrosine phosphorylated:
Y193, Y256, Y397, Y563, Y664, Y681, Y771, Y940.
Ubiquitinated:
K507.
Distribution
Based on gene microarray analysis from the NCBI
Human Tissue Distribution
% Max Expression:
Mean Expression:
Number of Samples:
Standard Deviation:
% Max Expression:
Mean Expression:
Number of Samples:
Standard Deviation:
 33
33
488
16
834
 1.4
1.4
21
10
19
 3
3
45
27
48
 34
34
494
64
1179
 17
17
246
14
244
 0.5
0.5
8
37
12
 39
39
577
19
579
 34
34
507
34
1505
 62
62
917
10
711
 2
2
28
62
42
 0.8
0.8
12
37
18
 18
18
265
129
391
 1
1
14
27
11
 0.7
0.7
10
8
8
 1.1
1.1
16
32
27
 0.5
0.5
8
8
7
 1.3
1.3
19
115
18
 1
1
15
33
28
 0.9
0.9
13
64
11
 17
17
249
56
274
 1
1
14
20
16
 0.7
0.7
10
23
10
 2
2
32
42
52
 0.5
0.5
7
29
10
 1
1
14
36
16
 100
100
1470
46
3330
 1
1
14
34
11
 1.2
1.2
17
19
24
 0.6
0.6
9
31
18
 8
8
114
14
57
 22
22
318
18
232
 24
24
347
21
414
 9
9
125
49
334
 25
25
373
36
435
 1.2
1.2
18
22
14
Evolution
Species Conservation
PhosphoNET % Identity:
PhosphoNET % Similarity:
Homologene %
Identity:
PhosphoNET % Identity:
PhosphoNET % Similarity:
Homologene %
Identity:
 100
100
100
100 99.3
99.3
99.5
99 97.6
97.6
98.8
98 -
-
-
85 -
-
-
87 87.8
87.8
93.6
88 -
-
-
- 81.8
81.8
90.1
82 82.5
82.5
90.8
83 -
-
-
- 73.6
73.6
83.7
- 67.8
67.8
80.6
68.5 62.4
62.4
77.1
64 31.4
31.4
37.4
58 -
-
-
- 27.9
27.9
45.2
- -
-
-
- 24.9
24.9
45.2
- 28.6
28.6
46.3
- -
-
-
- -
-
-
- -
-
-
- -
-
-
- -
-
-
- -
-
-
-
For a wider analysis go to PhosphoNET Evolution in PhosphoNET
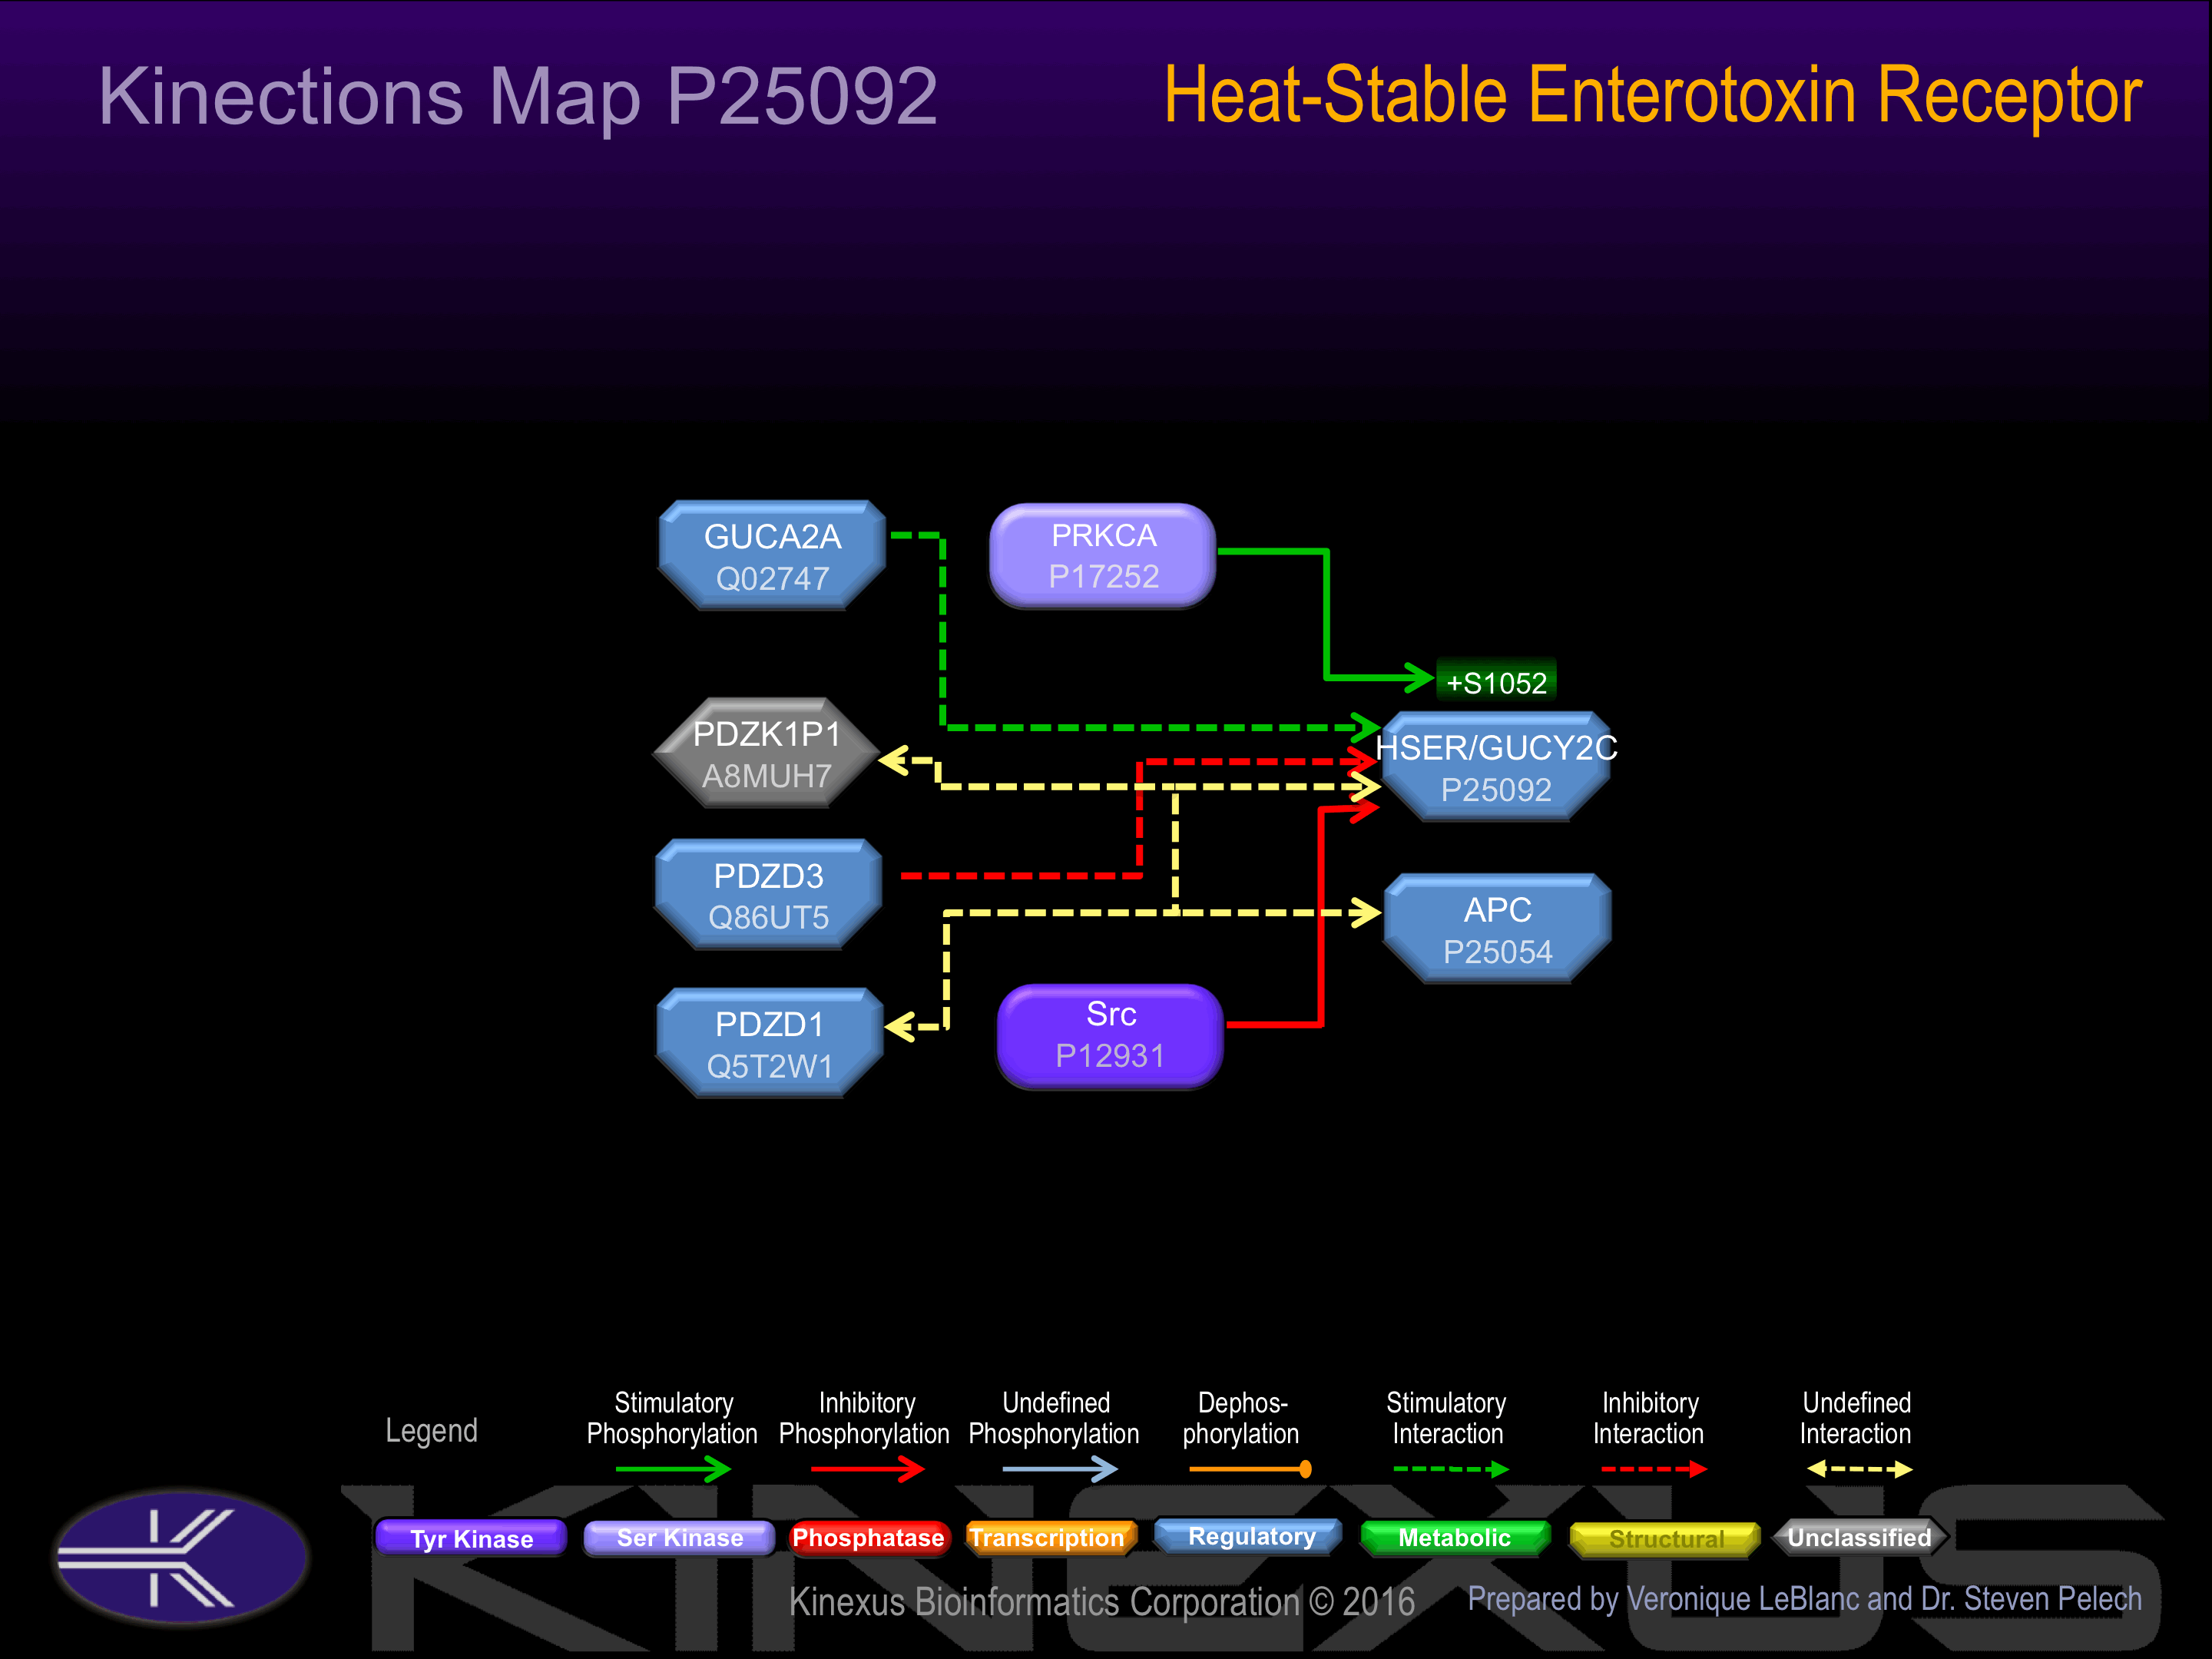
Binding Proteins
Examples of known interacting proteins
hiddentext
| No. | Name – UniProt ID |
|---|---|
| 1 | SRC - P12931 |
| 2 | PDZK1 - Q5T2W1 |
| 3 | PDZK1P1 - A8MUH7 |
| 4 | PDZD3 - Q86UT5 |
| 5 | GUCA2A - Q02747 |
Regulation
Activation:
Phosphorylation of Ser-1052 increases guanylate cyclase activity of receptor. Also activated by the endogenous peptide guanylin.
Inhibition:
NA
Synthesis:
NA
Degradation:
NA
Known Upstream Kinases
For further details on these substrates click on the Substrate Short Name or UniProt ID. Phosphosite Location is hyperlinked to PhosphoNET
predictions.
Based on in vitro and/or in vivo phosphorylation data
| Kinase Short Name | UniProt ID (Human) | Phosphosite Location | Phosphosite Sequence | Effect of Phosphorylation |
|---|
Protein Kinase Specificity
Matrix of observed frequency (%) of amino acids in aligned protein substrate phosphosites
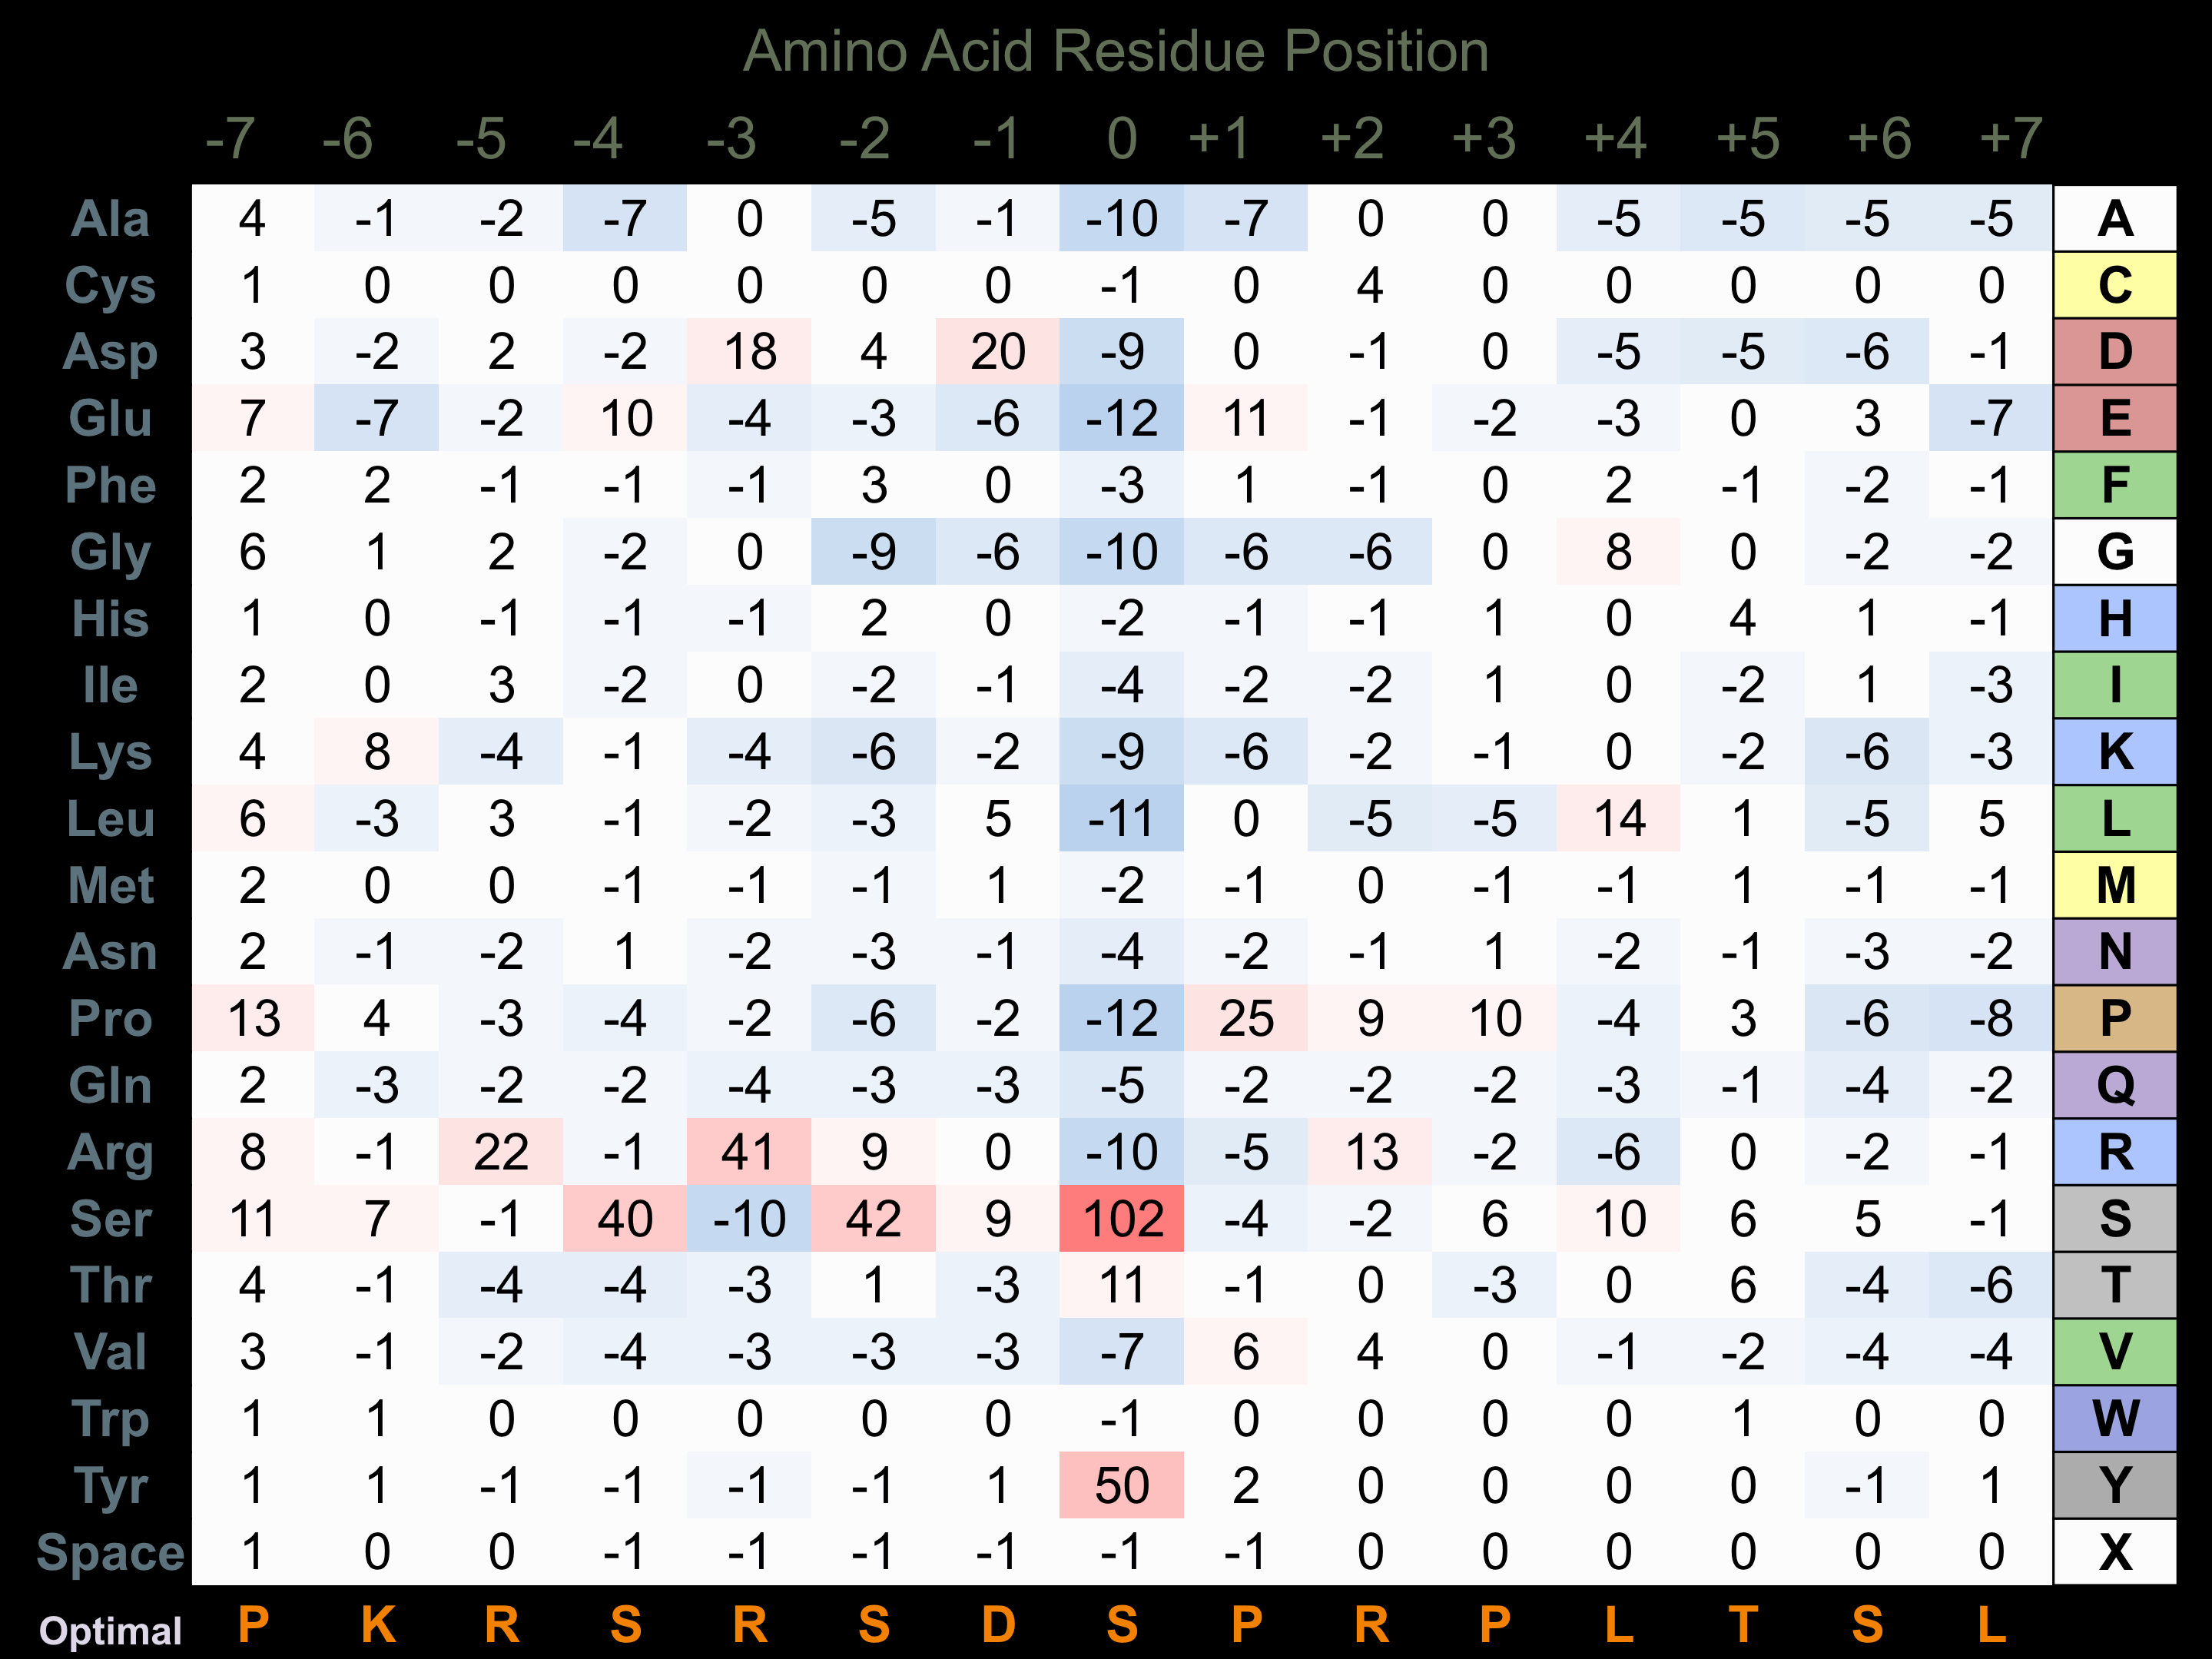
Matrix Type:
Predicted from the application of the Kinexus Kinase Substrate Predictor Version 2.0 algorithm, which was trained with over 10,000 kinase-protein substrate pairs and 8,000 kinase-peptide substrate pairs.
Domain #:
1
Disease Linkage
General Disease Association:
Cancer, gastrointestinal disorders
Specific Diseases (Non-cancerous):
Meconium ileus; Diarrhea; Ileus; Chronic diarrhea due to guanylate cyclase 2c overactivity; Intestinal obstruction
Comments:
Meconium ileus, also known as intestinal obstruction in the newborn due to guanylate cyclase 2C deficiency, is related to cystic fibrosis and diarrhea. The affected tissues in this disease include the pancreas, liver, and small intestine. This disease is characterized by the blockage of the baby's bowel at birth by the contents of the bowel (meconium). Roughly 90% of affected babies also have cystic fibrosis, as the blockage is a result of cystic fibrosis due to the production of a large quantity of an extremely sticky substance in the bowel. Meconium ileus is a rare disease, affecting only 1 in 25,000 births. Diarrhea is characterized by loose stools, which can be caused by bacteria, viruses, parasites, certain medicines, intolerances of certain foods, and gastrointestinal diseases. Mutations in the HSER gene have been linked to meconium ileus. In particular, a D387G substitution mutation was identified from a large Bedouin family with high rates of meconium ileus occurence. This mutation occurs at a conserved residue within one of the essential regions of the extracellular ligand-binding domain of the protein, thus it is associated with a loss-of-function. In vitro studies performed in HEK293 cells revealed that the mutant D387G protein had 60% lower activity than the wild type protein, confirming the loss-of-function phenotype. Additionally, in a sporadic case of meconium ileus a 1-bp duplication mutation was observed (2270dupA). This mutation caused a frameshift that resulted in the truncation of the catalytic domain of the protein (Asn757Lysfs*2), producing a non-functional HSER protein. In addition to meconium ileus, mutations in the HSER gene have been linked to the occurence of diarrhea. In particular, studies of a large pedigree of autosomal early-onset chronic diarrhea revealed a S840I substitution mutation in exon 22 of the HSER gene. This mutation occurs at a highly conserved residue in the catalytic domain of the protein. In vitro analysis of the S840I mutant HSER protein revealed a significantly elevated level of cGMP production as compared to the wild-type protein, indicating that the mutation produced a gain-of-function in the activity of the HSER protein that contributed to the pathogenesis of early-onset diarrhea. HSER binds to bacterially-derived heat-stable enterotoxin causing an elevation of cGMP in the cell and enhanced water and chloride secretion. Exposure to the heat-stable enterotoxin leads to secretory diarrhea due to the increased water secretion in the intestines. As a guanylate cyclase, when stimulated by the heat-stable enterotoxin, HSER catalyzed the conversion of GTP to cGMP elevating cellular cGMP levels, thus a gain-of-function in the HSER protein is implicated in suceptibility to the toxin.
Specific Cancer Types:
Ovarian mucinous neoplasms
Gene Expression in Cancers:
TranscriptoNET (www.transcriptonet.ca) analysis with mRNA expression data retrieved from the National Center for Biotechnology Information's Gene Expression Omnibus (GEO) database, which was normalized against 60 abundantly and commonly found proteins, indicated altered expression for this protein kinase as shown here as the percent change from normal tissue controls (%CFC) as supported with the Student T-test in the following types of human cancers: Brain glioblastomas (%CFC= -54, p<0.086); and Colorectal adenocarcinomas (early onset) (%CFC= -60, p<0.0001). The COSMIC website notes an up-regulated expression score for HSER in diverse human cancers of 261, which is 0.6-fold of the average score of 462 for the human protein kinases. The down-regulated expression score of 5 for this protein kinase in human cancers was 0.1-fold of the average score of 60 for the human protein kinases.
Mutagenesis Experiments:
Insertional mutagenesis studies in mice have not yet revealed a role for this protein kinase in mouse cancer oncogenesis.
Mutation Rate in All Cancers:
Percent mutation rates per 100 amino acids length in human cancers: 0.1 % in 24726 diverse cancer specimens. This rate is only 30 % higher than the average rate of 0.075 % calculated for human protein kinases in general.
Mutation Rate in Specific Cancers:
Highest percent mutation rates per 100 amino acids length in human cancers: 0.72 % in 864 skin cancers tested; 0.29 % in 1270 large intestine cancers tested; 0.26 % in 603 endometrium cancers tested; 0.21 % in 833 ovary cancers tested; 0.17 % in 1634 lung cancers tested; 0.14 % in 589 stomach cancers tested; 0.13 % in 1512 liver cancers tested; 0.11 % in 1316 breast cancers tested; 0.08 % in 942 upper aerodigestive tract cancers tested; 0.08 % in 710 oesophagus cancers tested; 0.08 % in 238 bone cancers tested; 0.05 % in 548 urinary tract cancers tested; 0.04 % in 1276 kidney cancers tested; 0.03 % in 2082 central nervous system cancers tested.
Frequency of Mutated Sites:
Most frequent mutations with the number of reports indicated in brackets: R319* (4); T946K (4).
Comments:
Multiple deletions in the C-terminal half of the protein, which encompasses the kinase and guanylate cyclase domains.