
Nomenclature
Short Name:
IRAK3
Full Name:
Interleukin-1 receptor-associated kinase-3
Alias:
- EC 2.7.11.1
- IRAK-M
- IRAK-M
Classification
Type:
Protein-serine/threonine kinase
Group:
TKL
Family:
IRAK
SubFamily:
NA

Structure
Mol. Mass (Da):
67,753
# Amino Acids:
596
# mRNA Isoforms:
2
mRNA Isoforms:
67,767 Da (596 AA; Q9Y616); 60,608 Da (535 AA; Q9Y616-2)
4D Structure:
NA
1D Structure:
Subfamily Alignment
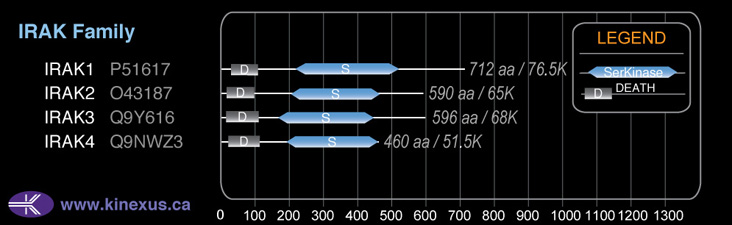
Domain Distribution:
Post-translation Modifications
For detailed information on phosphorylation of this kinase go to PhosphoNET
Acetylated:
K199.
Serine phosphorylated:
S110, S154, S398, S401, S415, S467, S484, S510, S512.
Threonine phosphorylated:
T162, T188.
Tyrosine phosphorylated:
Y189.
Ubiquitinated:
K379.
Distribution
Based on gene microarray analysis from the NCBI
Human Tissue Distribution
% Max Expression:
Mean Expression:
Number of Samples:
Standard Deviation:
% Max Expression:
Mean Expression:
Number of Samples:
Standard Deviation:
 59
59
1010
38
1194
 0.5
0.5
9
16
6
 6
6
99
13
106
 14
14
240
119
655
 28
28
474
30
358
 5
5
92
89
312
 5
5
79
41
206
 17
17
291
43
410
 18
18
314
17
261
 1.2
1.2
21
84
34
 2
2
28
33
46
 35
35
589
172
542
 4
4
63
35
119
 0.7
0.7
12
12
9
 2
2
29
28
68
 1.5
1.5
25
20
21
 2
2
28
201
33
 3
3
47
21
69
 2
2
28
88
39
 25
25
427
132
432
 3
3
53
26
71
 10
10
167
30
244
 12
12
208
15
278
 2
2
36
22
56
 3
3
48
26
76
 41
41
703
78
1261
 3
3
51
38
97
 6
6
101
22
148
 4
4
72
22
114
 3
3
53
28
63
 20
20
335
24
338
 100
100
1698
41
5941
 1.1
1.1
19
123
35
 55
55
938
78
736
 4
4
69
48
50
Evolution
Species Conservation
PhosphoNET % Identity:
PhosphoNET % Similarity:
Homologene %
Identity:
PhosphoNET % Identity:
PhosphoNET % Similarity:
Homologene %
Identity:
 100
100
100
100 98.9
98.9
99.5
99 96.3
96.3
98.1
96.5 -
-
-
82 -
-
-
- 75.6
75.6
83.5
83 -
-
-
- 74.7
74.7
84.2
76 75.5
75.5
84.9
77 -
-
-
- 56.3
56.3
70.2
- 24
24
42.5
- -
-
-
- 35.1
35.1
51.9
48 -
-
-
- -
-
-
- -
-
-
- -
-
-
- -
-
-
- -
-
-
- -
-
-
- -
-
-
- 23.8
23.8
38.4
- -
-
-
- -
-
-
-
For a wider analysis go to PhosphoNET Evolution in PhosphoNET
Binding Proteins
Examples of known interacting proteins
hiddentext
| No. | Name – UniProt ID |
|---|---|
| 1 | TRAF6 - Q9Y4K3 |
| 2 | IRAK2 - O43187 |
| 3 | IRAK1 - P51617 |
Regulation
Activation:
NA
Inhibition:
NA
Synthesis:
NA
Degradation:
NA
Protein Kinase Specificity
Matrix of observed frequency (%) of amino acids in aligned protein substrate phosphosites
Matrix Type:
Predicted from the application of the Kinexus Kinase Substrate Predictor Version 2.0 algorithm, which was trained with over 10,000 kinase-protein substrate pairs and 8,000 kinase-peptide substrate pairs.
Domain #:
1
Inhibitors
For further details on these inhibitors click on the Compound Name and enter it into DrugKiNET or click on the ID's
Based on in vitro and/or in vivo phosphorylation data
| Compound Name | KD, Ki or IC50 (nM) | PubChem ID | ChEMBL ID | PubMed ID |
|---|
Disease Linkage
General Disease Association:
Respiratory disorders
Specific Diseases (Non-cancerous):
Asthma susceptibility 5; Asthma; Melioidosis
Comments:
Asthma is a respiratory disease characterized by inflammation of the bronchial epithelium and submucosa that results in the irrevesible change of the anatomy of the bronchi and permanently impaired lung function. The symptoms of asthma include shortness of breath, wheezing, coughing, and overactive mucus production. In Western industrialized countries, the prevalence of asthma is ~5% and growing steadily, with increasing occurence of mortality. Melioidosis, also called Whitmore's disease, is a bacterial infectious disease that is caused by Burkholderia pseudomallei, which can be transmitted through contaminated water and soil. The symptoms of the disease include respiratory distress, chest pain, and stomach pain. Mutations in IRAK3 have been linked to early-onset asthma in Sardinian families, thus the IRAK3 gene is a candidate factor for asthma suceptibility. Two SNPs in the IRAK3 gene were associated with the development of asthma, indicating that variants of this gene may have an important role in the pathogenesis of asthma, specifically in European populations. A particular haplotype containing SNPs in the IRAK3 gene was found to be associated with asthma, referred to as the 'risk haplotype' (TAT) which is linked with early-onset persistent asthma. In addition, inactivating mutations were observed in the IRAK3 coding region in asthma patients. These mutations were co-inherited with a risk haplotype, predisposing the individuals to early-onset asthma. Immunohistochemical analysis of lung biopsies from asthma patients showed that IRAK3 is highly expressed in the lung epithelial cells, therefore IRAK3 has been proposed as a potential target for the therapeutic intervention to alleviate asthma symptoms. In animal studies, IRAK3 expression was found to be elevated in septic mice. Additionally, septic mice lacking a functional IRAK3 protein had decreased mortality, as well as a reduced count of bacteria in blood and lung samples. Furthermore, mice lacking functional IRAK3 displayed increased neutrophil numbers and reduced lymphocyte numbers in samples of bronchoalveolar fluid. It was concluded that IRAK3 functions in the regulation of innate immunity and contributes to an immunocompromised state during bacterial infections.
Gene Expression in Cancers:
TranscriptoNET (www.transcriptonet.ca) analysis with mRNA expression data retrieved from the National Center for Biotechnology Information's Gene Expression Omnibus (GEO) database, which was normalized against 60 abundantly and commonly found proteins, indicated altered expression for this protein kinase as shown here as the percent change from normal tissue controls (%CFC) as supported with the Student T-test in the following types of human cancers: Breast epithelial hyperplastic enlarged lobular units (HELU) (%CFC= -48, p<0.01); Ovary adenocarcinomas (%CFC= -50, p<0.0002); and Skin melanomas - malignant (%CFC= -87, p<0.0008). The COSMIC website notes an up-regulated expression score for IRAK3 in diverse human cancers of 408, which is 0.9-fold of the average score of 462 for the human protein kinases. The down-regulated expression score of 5 for this protein kinase in human cancers was 0.1-fold of the average score of 60 for the human protein kinases.
Mutagenesis Experiments:
Insertional mutagenesis studies in mice have not yet revealed a role for this protein kinase in mouse cancer oncogenesis.
Mutation Rate in All Cancers:
Percent mutation rates per 100 amino acids length in human cancers: 0.09 % in 25418 diverse cancer specimens. This rate is only 26 % higher than the average rate of 0.075 % calculated for human protein kinases in general.
Mutation Rate in Specific Cancers:
Highest percent mutation rates per 100 amino acids length in human cancers: 0.41 % in 864 skin cancers tested; 0.31 % in 603 endometrium cancers tested; 0.3 % in 1270 large intestine cancers tested; 0.28 % in 589 stomach cancers tested; 0.21 % in 238 bone cancers tested; 0.18 % in 273 cervix cancers tested; 0.18 % in 1014 upper aerodigestive tract cancers tested; 0.16 % in 1956 lung cancers tested; 0.15 % in 548 urinary tract cancers tested; 0.09 % in 1512 liver cancers tested; 0.09 % in 1490 breast cancers tested; 0.07 % in 710 oesophagus cancers tested; 0.06 % in 2082 central nervous system cancers tested; 0.05 % in 1276 kidney cancers tested; 0.04 % in 891 ovary cancers tested; 0.04 % in 382 soft tissue cancers tested; 0.03 % in 1459 pancreas cancers tested; 0.02 % in 939 prostate cancers tested.
Frequency of Mutated Sites:
Most frequent mutations with the number of reports indicated in brackets: R267Q (6).
Comments:
Only 2 deletions and 1 insertion, and no complex mutations are noted on the COSMIC website.