
Nomenclature
Short Name:
IRE1
Full Name:
Serine-threonine protein kinase-endoribonuclease IRE1
Alias:
- Endoplasmic reticulum to nucleus signaling 1
- ERN1
- IRE1P
- Kinase IRE1
- Protein kinase/endoribonulcease
Classification
Type:
Protein-serine/threonine kinase
Group:
Other
Family:
IRE
SubFamily:
NA

Specific Links
Structure
Mol. Mass (Da):
109735
# Amino Acids:
977
# mRNA Isoforms:
2
mRNA Isoforms:
109,735 Da (977 AA; O75460); 6,649 Da (70 AA; O75460-2)
4D Structure:
Homodimer; disulfide-linked. Dimer formation is driven by hydrophobic interactions within the N-terminal luminal domains and stabilized by disulfide bridges. Also binds HSPA5, a negative regulator of the unfolded protein response. This interaction may disrupt homodimerization and prevent activation of ERN1.
1D Structure:
3D Image (rendered using PV Viewer):
PDB ID
Subfamily Alignment
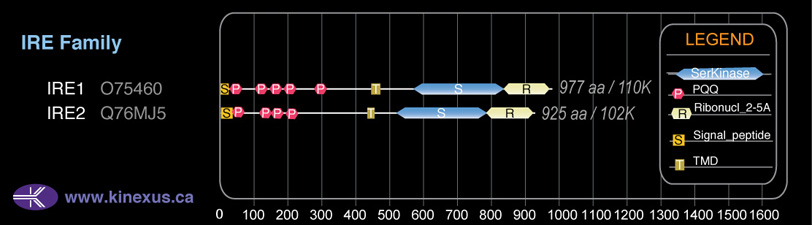
Domain Distribution:
| Start | End | Domain |
|---|---|---|
| 1 | 18 | signal_peptide |
| 26 | 57 | PQQ |
| 108 | 140 | PQQ |
| 146 | 178 | PQQ |
| 189 | 221 | PQQ |
| 277 | 308 | PQQ |
| 445 | 467 | TMD |
| 571 | 832 | Pkinase |
| 837 | 963 | Ribonuc_2-5A |
| 835 | 963 | KEN |
Post-translation Modifications
For detailed information on phosphorylation of this kinase go to PhosphoNET
Acetylated:
K374.
N-GlcNAcylated:
N176.
Serine phosphorylated:
S544, S548, S551, S724+, S726+.
Threonine phosphorylated:
T49, T132, T283, T973.
Tyrosine phosphorylated:
Y117, Y161, Y166, Y179, Y289, Y628.
Ubiquitinated:
K633.
Distribution
Based on gene microarray analysis from the NCBI
Human Tissue Distribution
% Max Expression:
Mean Expression:
Number of Samples:
Standard Deviation:
% Max Expression:
Mean Expression:
Number of Samples:
Standard Deviation:
 55
55
1539
19
1453
 4
4
122
9
116
 3
3
78
1
0
 17
17
475
71
1487
 16
16
445
24
331
 0.8
0.8
23
46
11
 8
8
224
29
522
 17
17
476
19
629
 8
8
214
10
178
 3
3
91
70
99
 3
3
75
16
92
 22
22
618
92
605
 2
2
58
12
14
 2
2
65
6
59
 2
2
56
13
62
 9
9
252
12
323
 0.6
0.6
18
179
21
 2
2
65
6
53
 3
3
89
61
45
 14
14
394
84
364
 1.2
1.2
33
12
37
 2
2
58
14
51
 3
3
84
2
50
 3
3
92
6
106
 2
2
62
12
53
 22
22
622
38
549
 2
2
52
15
43
 2
2
66
6
61
 2
2
57
6
50
 8
8
222
28
160
 21
21
598
18
362
 100
100
2823
26
5120
 5
5
130
62
301
 28
28
790
52
663
 4
4
112
35
85
Evolution
Species Conservation
PhosphoNET % Identity:
PhosphoNET % Similarity:
Homologene %
Identity:
PhosphoNET % Identity:
PhosphoNET % Similarity:
Homologene %
Identity:
 100
100
100
100 83.7
83.7
84.8
100 90.4
90.4
91
99 -
-
-
94.5 -
-
-
- 95.5
95.5
97.3
95.5 -
-
-
- 93.1
93.1
96.3
93.5 92.1
92.1
94.9
93.5 -
-
-
- 83
83
89.4
- -
-
-
83.5 56.1
56.1
71.4
59.5 57
57
69.8
62 -
-
-
- 37.7
37.7
53
52 43.1
43.1
58.6
- 41.4
41.4
59.4
49 41.5
41.5
54.4
- -
-
-
- -
-
-
- -
-
-
- -
-
-
- 25.2
25.2
44.1
- -
-
-
-
For a wider analysis go to PhosphoNET Evolution in PhosphoNET
Binding Proteins
Examples of known interacting proteins
hiddentext
| No. | Name – UniProt ID |
|---|---|
| 1 | TNFRSF1A - P19438 |
| 2 | HSP90AA2 - Q14568 |
| 3 | HSP90AA1 - P07900 |
| 4 | BAK1P1 - Q13014 |
| 5 | MAP3K5 - Q99683 |
| 6 | HSPA5 - P11021 |
| 7 | COPS5 - Q92905 |
| 8 | TRAF2 - Q12933 |
| 9 | PSEN1 - P49768 |
| 10 | RPS27A - P62988 |
| 11 | SYVN1 - Q86TM6 |
| 12 | BAX - Q07812 |
| 13 | BAK1 - Q16611 |
| 14 | SEC13 - P55735 |
| 15 | COPB2 - P35606 |
Regulation
Activation:
The kinase domain is activated by trans-autophosphorylation. Kinase activity is required for activation of the endoribonuclease domain.
Inhibition:
NA
Synthesis:
NA
Degradation:
NA
Protein Kinase Specificity
Matrix of observed frequency (%) of amino acids in aligned protein substrate phosphosites
Matrix Type:
Predicted from the application of the Kinexus Kinase Substrate Predictor Version 2.0 algorithm, which was trained with over 10,000 kinase-protein substrate pairs and 8,000 kinase-peptide substrate pairs.
Domain #:
1
Inhibitors
For further details on these inhibitors click on the Compound Name and enter it into DrugKiNET or click on the ID's
Based on in vitro and/or in vivo phosphorylation data
| Compound Name | KD, Ki or IC50 (nM) | PubChem ID | ChEMBL ID | PubMed ID |
|---|
Disease Linkage
General Disease Association:
Cancer
Specific Cancer Types:
Hepatocellular carcinomas (HCC)
Comments:
MicroRNA-1291, which is bound to a complementary site in the 5-prime UTR of IRE1A and directs its degradation, has been shown to be upregulated in hepatocellular carcinoma.
Gene Expression in Cancers:
The COSMIC website notes an up-regulated expression score for IRE1 in diverse human cancers of 356, which is 0.8-fold of the average score of 462 for the human protein kinases. The down-regulated expression score of 1 for this protein kinase in human cancers was 98% lower than the average score of 60 for the human protein kinases.
Mutagenesis Experiments:
Insertional mutagenesis studies in mice have not yet revealed a role for this protein kinase in mouse cancer oncogenesis. A K599A substitution can lead to loss of autophosphorylation and endoribonuclease activity, and inhibition of growth arrest. Other mutations at amino acid residues 109, 148, and 332 do not affect dimerization.
Mutation Rate in All Cancers:
Percent mutation rates per 100 amino acids length in human cancers: 0.06 % in 24839 diverse cancer specimens. This rate is only -24 % lower than the average rate of 0.075 % calculated for human protein kinases in general.
Mutation Rate in Specific Cancers:
Highest percent mutation rates per 100 amino acids length in human cancers: 0.33 % in 864 skin cancers tested; 0.23 % in 615 stomach cancers tested; 0.18 % in 1270 large intestine cancers tested; 0.17 % in 603 endometrium cancers tested; 0.13 % in 710 oesophagus cancers tested; 0.1 % in 833 ovary cancers tested; 0.07 % in 441 autonomic ganglia cancers tested; 0.07 % in 273 cervix cancers tested; 0.06 % in 492 upper aerodigestive tract cancers tested; 0.06 % in 1634 lung cancers tested; 0.06 % in 1459 pancreas cancers tested; 0.04 % in 1316 breast cancers tested; 0.03 % in 382 soft tissue cancers tested; 0.03 % in 1364 kidney cancers tested; 0.02 % in 548 urinary tract cancers tested; 0.02 % in 2081 central nervous system cancers tested; 0.02 % in 1512 liver cancers tested; 0.01 % in 2009 haematopoietic and lymphoid cancers tested.
Frequency of Mutated Sites:
Most frequent mutations with the number of reports indicated in brackets: S570F (4).
Comments:
Only 3 deletions, 2 insertions, and no complex mutations are noted on the COSMIC website.