
Nomenclature
Short Name:
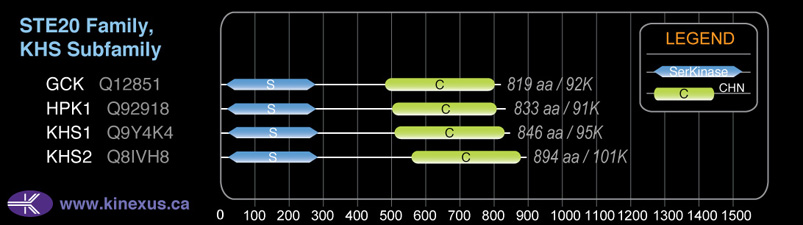
KHS2
Full Name:
Mitogen-activated protein kinase kinase kinase kinase 3
Alias:
- EC 2.7.11.1
- Germinal center kinase related protein kinase
- MAPK,ERK kinase kinase kinase 3
- MAPK/ERK kinase kinase kinase 3
- MAPKKKK3
- RAB8IPL1
- GLK
- Kinase KHS2
- M4K3
- MAP4K3
Classification
Type:
Protein-serine/threonine kinase
Group:
STE
Family:
STE20
SubFamily:
KHS

Specific Links
Structure
Mol. Mass (Da):
101,316
# Amino Acids:
894
# mRNA Isoforms:
3
mRNA Isoforms:
101,316 Da (894 AA; Q8IVH8); 100,133 Da (884 AA; Q8IVH8-2); 98,954 Da (873 AA; Q8IVH8-3)
4D Structure:
Interacts with SH3GL2. Interaction appears to regulate MAP4K3-mediated JNK activation
1D Structure:
Subfamily Alignment
Domain Distribution:
Post-translation Modifications
For detailed information on phosphorylation of this kinase go to PhosphoNET
Acetylated:
K530, K541.
Serine phosphorylated:
S24, S158, S170+, S280, S329, S398, S422, S467, S533, S616, S618, S743.
Threonine phosphorylated:
T26, T327, T539.
Tyrosine phosphorylated:
Y27, Y31, Y366, Y367, Y379, Y387, Y735.
Distribution
Based on gene microarray analysis from the NCBI
Human Tissue Distribution
% Max Expression:
Mean Expression:
Number of Samples:
Standard Deviation:
% Max Expression:
Mean Expression:
Number of Samples:
Standard Deviation:
 18
18
707
16
850
 1.2
1.2
46
8
12
 4
4
162
34
156
 10
10
369
87
784
 21
21
805
14
747
 1.2
1.2
47
37
29
 2
2
90
15
23
 6
6
233
58
271
 17
17
668
10
639
 4
4
171
72
189
 2
2
76
51
77
 13
13
506
113
548
 2
2
61
45
66
 3
3
115
6
75
 4
4
136
48
164
 3
3
110
7
40
 3
3
109
191
796
 3
3
124
39
122
 6
6
231
70
236
 20
20
778
56
813
 4
4
155
47
151
 3
3
109
49
123
 5
5
201
35
217
 7
7
264
39
305
 2
2
76
47
78
 12
12
443
62
528
 3
3
100
48
122
 3
3
108
39
115
 4
4
164
39
175
 0.4
0.4
16
14
15
 18
18
685
18
460
 100
100
3830
18
8349
 3
3
98
50
213
 26
26
981
26
759
 10
10
395
22
443
Evolution
Species Conservation
PhosphoNET % Identity:
PhosphoNET % Similarity:
Homologene %
Identity:
PhosphoNET % Identity:
PhosphoNET % Similarity:
Homologene %
Identity:
 100
100
100
100 74
74
74.3
99 25.3
25.3
38.9
99 -
-
-
97 -
-
-
92 98
98
99
98 -
-
-
- 96
96
97.7
96 94.2
94.2
95.8
96 -
-
-
- 68
68
69.7
- 25.9
25.9
38.9
90.5 24.5
24.5
38.4
91 24.6
24.6
38.5
79 -
-
-
- -
-
-
65 51.8
51.8
67.8
- 24
24
42.8
49 -
-
-
- -
-
-
- -
-
-
- -
-
-
- -
-
-
- -
-
-
- -
-
-
-
For a wider analysis go to PhosphoNET Evolution in PhosphoNET
Regulation
Activation:
NA
Inhibition:
NA
Synthesis:
NA
Degradation:
NA
Protein Kinase Specificity
Matrix of observed frequency (%) of amino acids in aligned protein substrate phosphosites
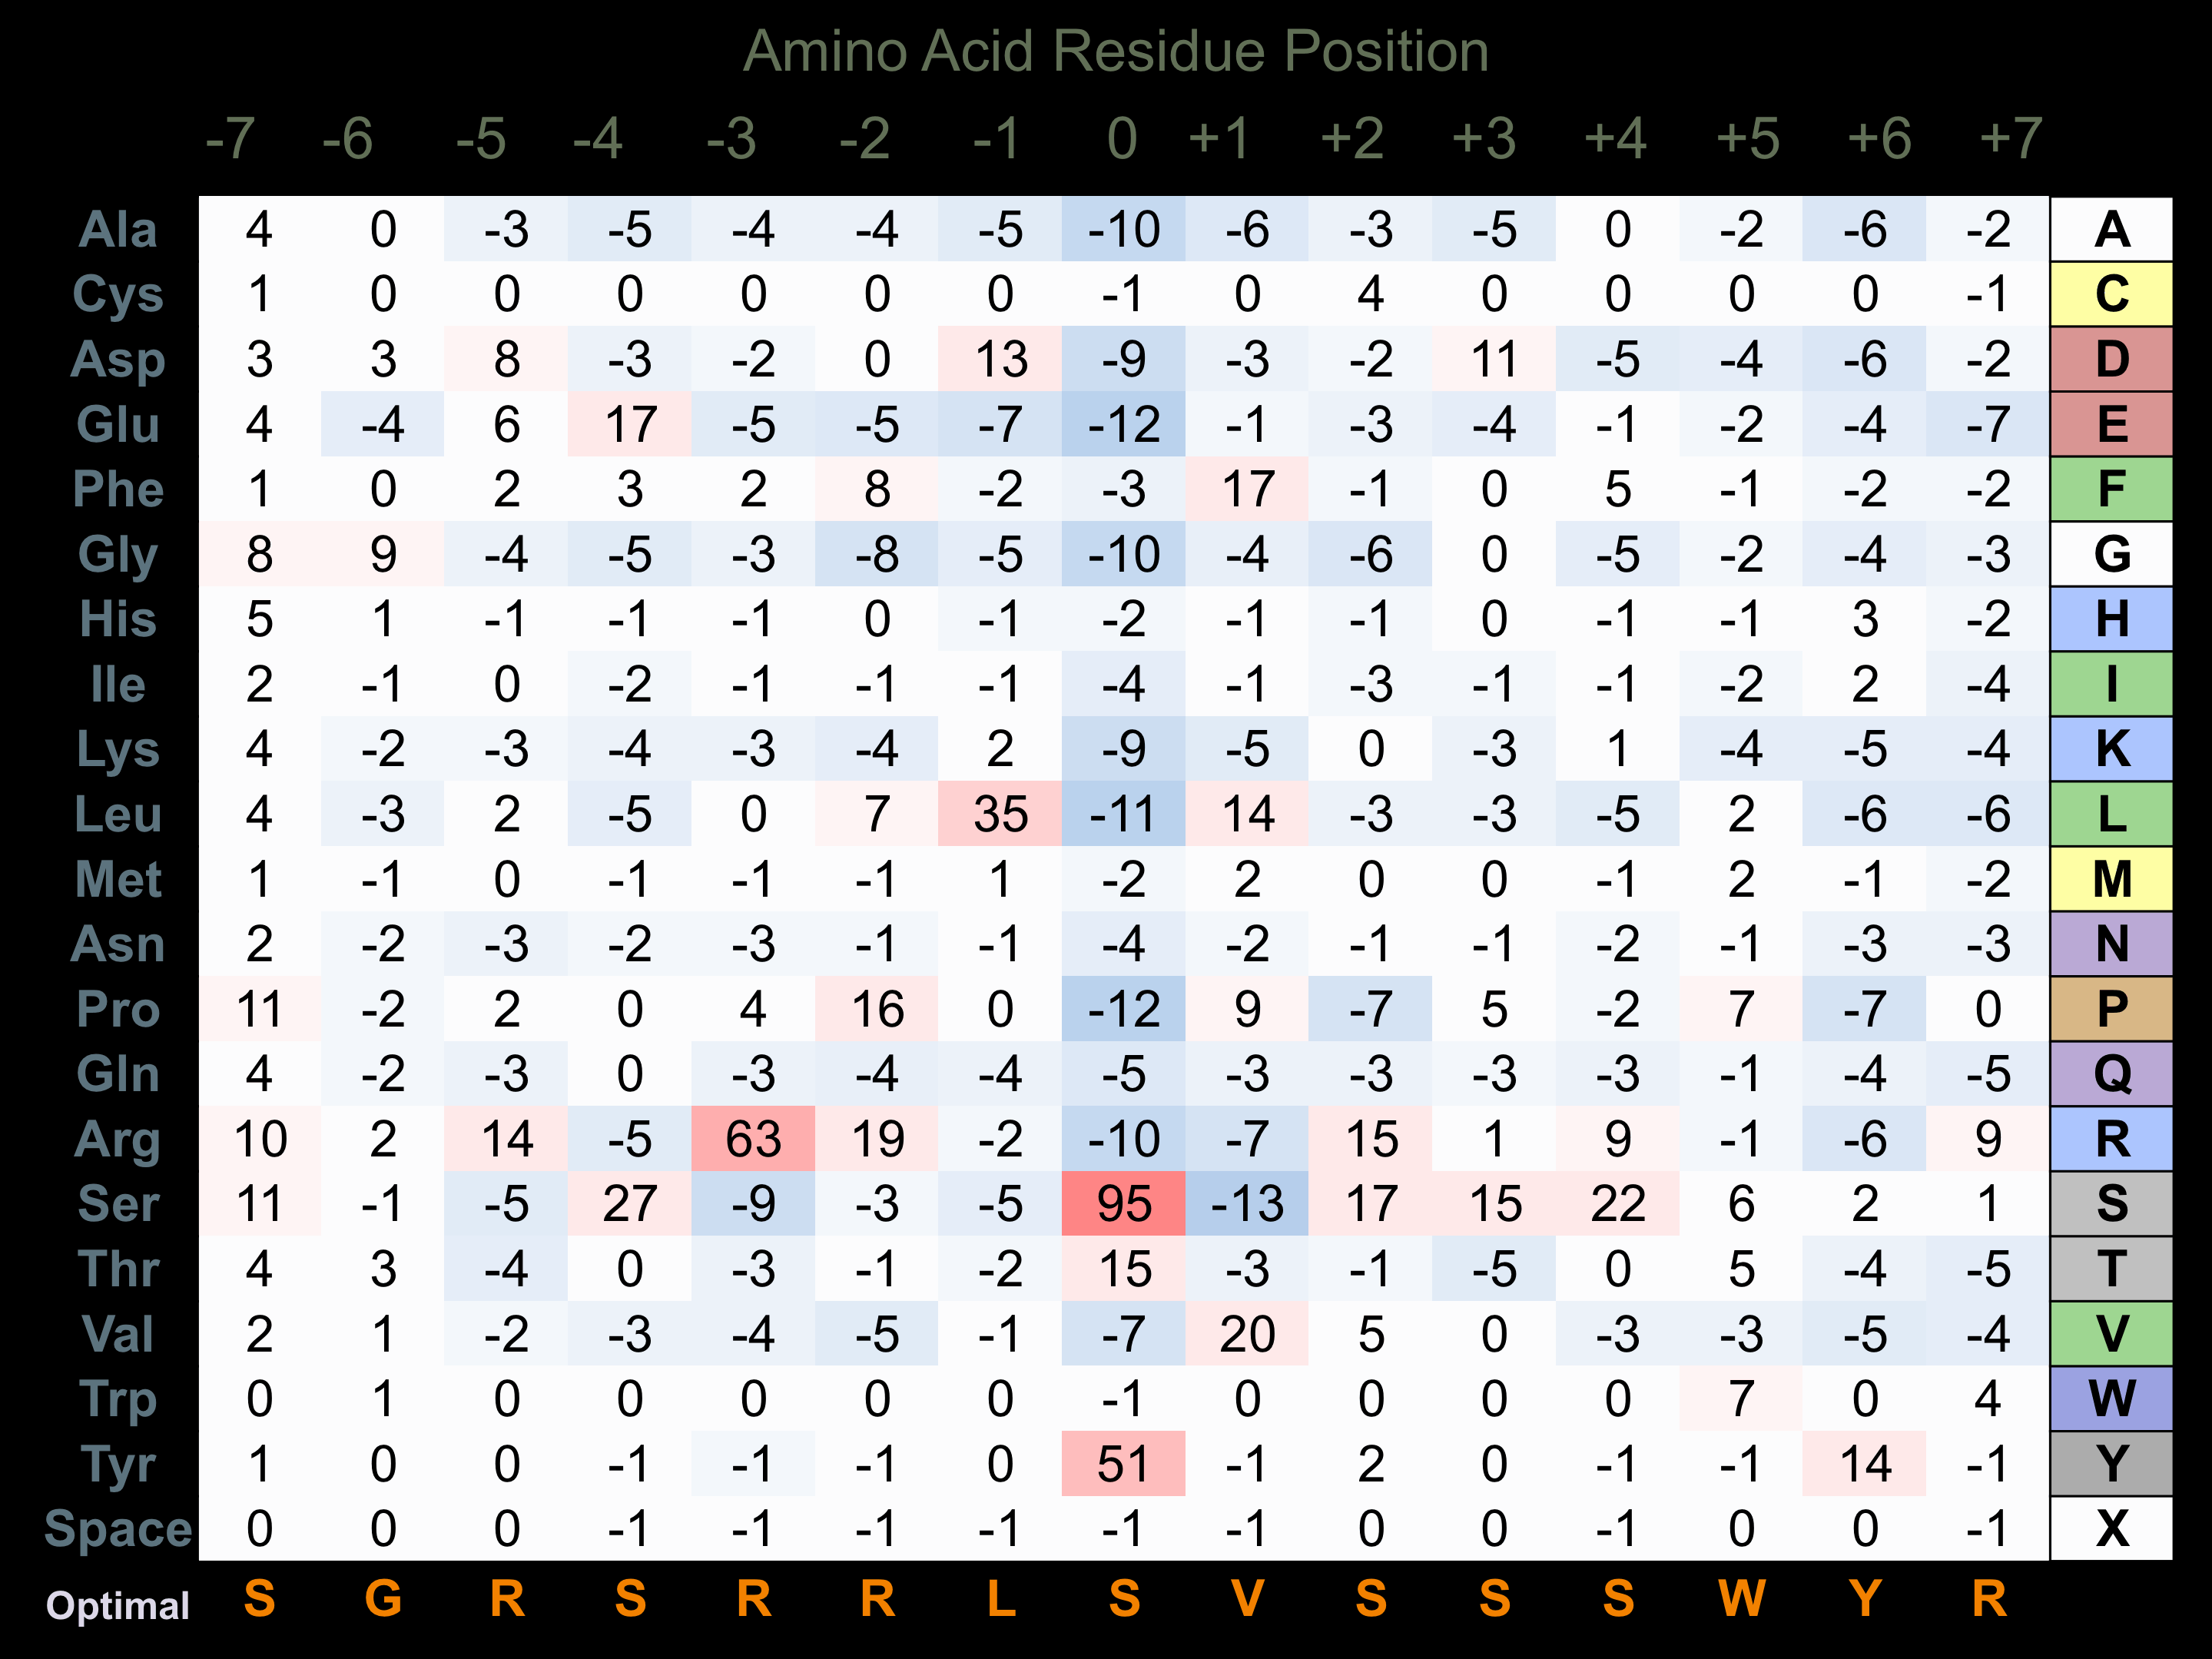
Matrix Type:
Predicted from the application of the Kinexus Kinase Substrate Predictor Version 2.0 algorithm, which was trained with over 10,000 kinase-protein substrate pairs and 8,000 kinase-peptide substrate pairs.
Domain #:
1
Inhibitors
For further details on these inhibitors click on the Compound Name and enter it into DrugKiNET or click on the ID's
Based on in vitro and/or in vivo phosphorylation data
| Compound Name | KD, Ki or IC50 (nM) | PubChem ID | ChEMBL ID | PubMed ID |
|---|
Disease Linkage
Gene Expression in Cancers:
TranscriptoNET (www.transcriptonet.ca) analysis with mRNA expression data retrieved from the National Center for Biotechnology Information's Gene Expression Omnibus (GEO) database, which was normalized against 60 abundantly and commonly found proteins, indicated altered expression for this protein kinase as shown here as the percent change from normal tissue controls (%CFC) as supported with the Student T-test in the following types of human cancers: Bladder carcinomas (%CFC= +112, p<0.003); Breast epithelial hyperplastic enlarged lobular units (HELU) (%CFC= +79, p<0.087); Malignant pleural mesotheliomas (MPM) tumours (%CFC= +57, p<0.09); Ovary adenocarcinomas (%CFC= -59, p<0.005); Prostate cancer - metastatic (%CFC= +51, p<0.04); and Skin melanomas - malignant (%CFC= -51, p<0.003). The COSMIC website notes an up-regulated expression score for KHS2 in diverse human cancers of 488, which is close to the average score of 462 for the human protein kinases. The down-regulated expression score of 74 for this protein kinase in human cancers was 1.2-fold of the average score of 60 for the human protein kinases.
Mutagenesis Experiments:
Insertional mutagenesis studies in mice have not yet revealed a role for this protein kinase in mouse cancer oncogenesis. A K48E mutation has been associated with abrogation of its kinase activity andreduced JNK activation.
Mutation Rate in All Cancers:
Percent mutation rates per 100 amino acids length in human cancers: 0.07 % in 24940 diverse cancer specimens. This rate is only -3 % lower and is very similar to the average rate of 0.075 % calculated for human protein kinases in general.
Mutation Rate in Specific Cancers:
Highest percent mutation rates per 100 amino acids length in human cancers: 0.44 % in 1093 large intestine cancers tested; 0.31 % in 805 skin cancers tested; 0.24 % in 602 endometrium cancers tested; 0.17 % in 1868 lung cancers tested.
Frequency of Mutated Sites:
None > 5 in 20,223 cancer specimens
Comments:
Only 1 deletion and 2 insertions and no complex mutations are noted on the COSMIC website.