Nomenclature
Short Name:
LMR3
Full Name:
Lemur tyrosine kinase 3
Alias:
- EC 2.7.11.1
- KIAA1883
- LMTK3
- TYKLM3
Classification
Type:
Protein-tyrosine kinase
Group:
TK
Family:
Lmr
SubFamily:
NA
Structure
Mol. Mass (Da):
153661
# Amino Acids:
1460
# mRNA Isoforms:
1
mRNA Isoforms:
153,661 Da (1460 AA; Q96Q04)
4D Structure:
NA
1D Structure:
Subfamily Alignment

Domain Distribution:
| Start | End | Domain |
|---|---|---|
| 1 | 40 | signal_peptide |
| 58 | 80 | TMD |
| 133 | 410 | Pkinase |
| 213 | 235 | TMD |
Post-translation Modifications
For detailed information on phosphorylation of this kinase go to PhosphoNET
Acetylated:
K1080.
N-GlcNAcylated:
N1081, N1405.
Serine phosphorylated:
S531, S1183.
Threonine phosphorylated:
T908, T995, T1241.
Tyrosine phosphorylated:
Y156, Y296, Y297.
Distribution
Based on gene microarray analysis from the NCBI
Human Tissue Distribution
% Max Expression:
Mean Expression:
Number of Samples:
Standard Deviation:
% Max Expression:
Mean Expression:
Number of Samples:
Standard Deviation:
 20
20
1138
9
1000
 17
17
975
7
1428
 -
-
-
-
-
 5
5
295
29
515
 19
19
1048
7
97
 0.3
0.3
18
9
6
 0.3
0.3
14
10
8
 9
9
513
6
568
 -
-
-
-
-
 23
23
1290
6
1833
 10
10
575
6
306
 12
12
679
12
520
 8
8
424
6
472
 6
6
345
6
156
 13
13
721
6
1252
 2
2
113
11
120
 2
2
120
10
122
 15
15
826
6
1134
 44
44
2457
6
3125
 8
8
455
29
195
 21
21
1183
6
1483
 -
-
-
-
-
 -
-
-
-
-
 7
7
379
12
346
 6
6
334
6
415
 10
10
532
22
482
 6
6
318
6
394
 6
6
335
6
193
 12
12
687
6
666
 -
-
-
-
-
 -
-
-
-
-
 100
100
5587
17
10072
 0
0
2
12
0
 12
12
692
26
596
 3
3
153
22
118
Evolution
Species Conservation
PhosphoNET % Identity:
PhosphoNET % Similarity:
Homologene %
Identity:
PhosphoNET % Identity:
PhosphoNET % Similarity:
Homologene %
Identity:
 100
100
100
100 28.1
28.1
43.2
95 43.9
43.9
49.7
- -
-
-
93 -
-
-
- 31.7
31.7
42.3
91 -
-
-
- 87.7
87.7
90.9
89 31.6
31.6
43.3
89 -
-
-
- 23.3
23.3
36.1
- 27.2
27.2
42.4
- -
-
-
64 28.9
28.9
43.1
- -
-
-
- -
-
-
- -
-
-
- -
-
-
- -
-
-
- -
-
-
- -
-
-
- -
-
-
- -
-
-
- -
-
-
- -
-
-
-
For a wider analysis go to PhosphoNET Evolution in PhosphoNET
Regulation
Activation:
NA
Inhibition:
NA
Synthesis:
NA
Degradation:
NA
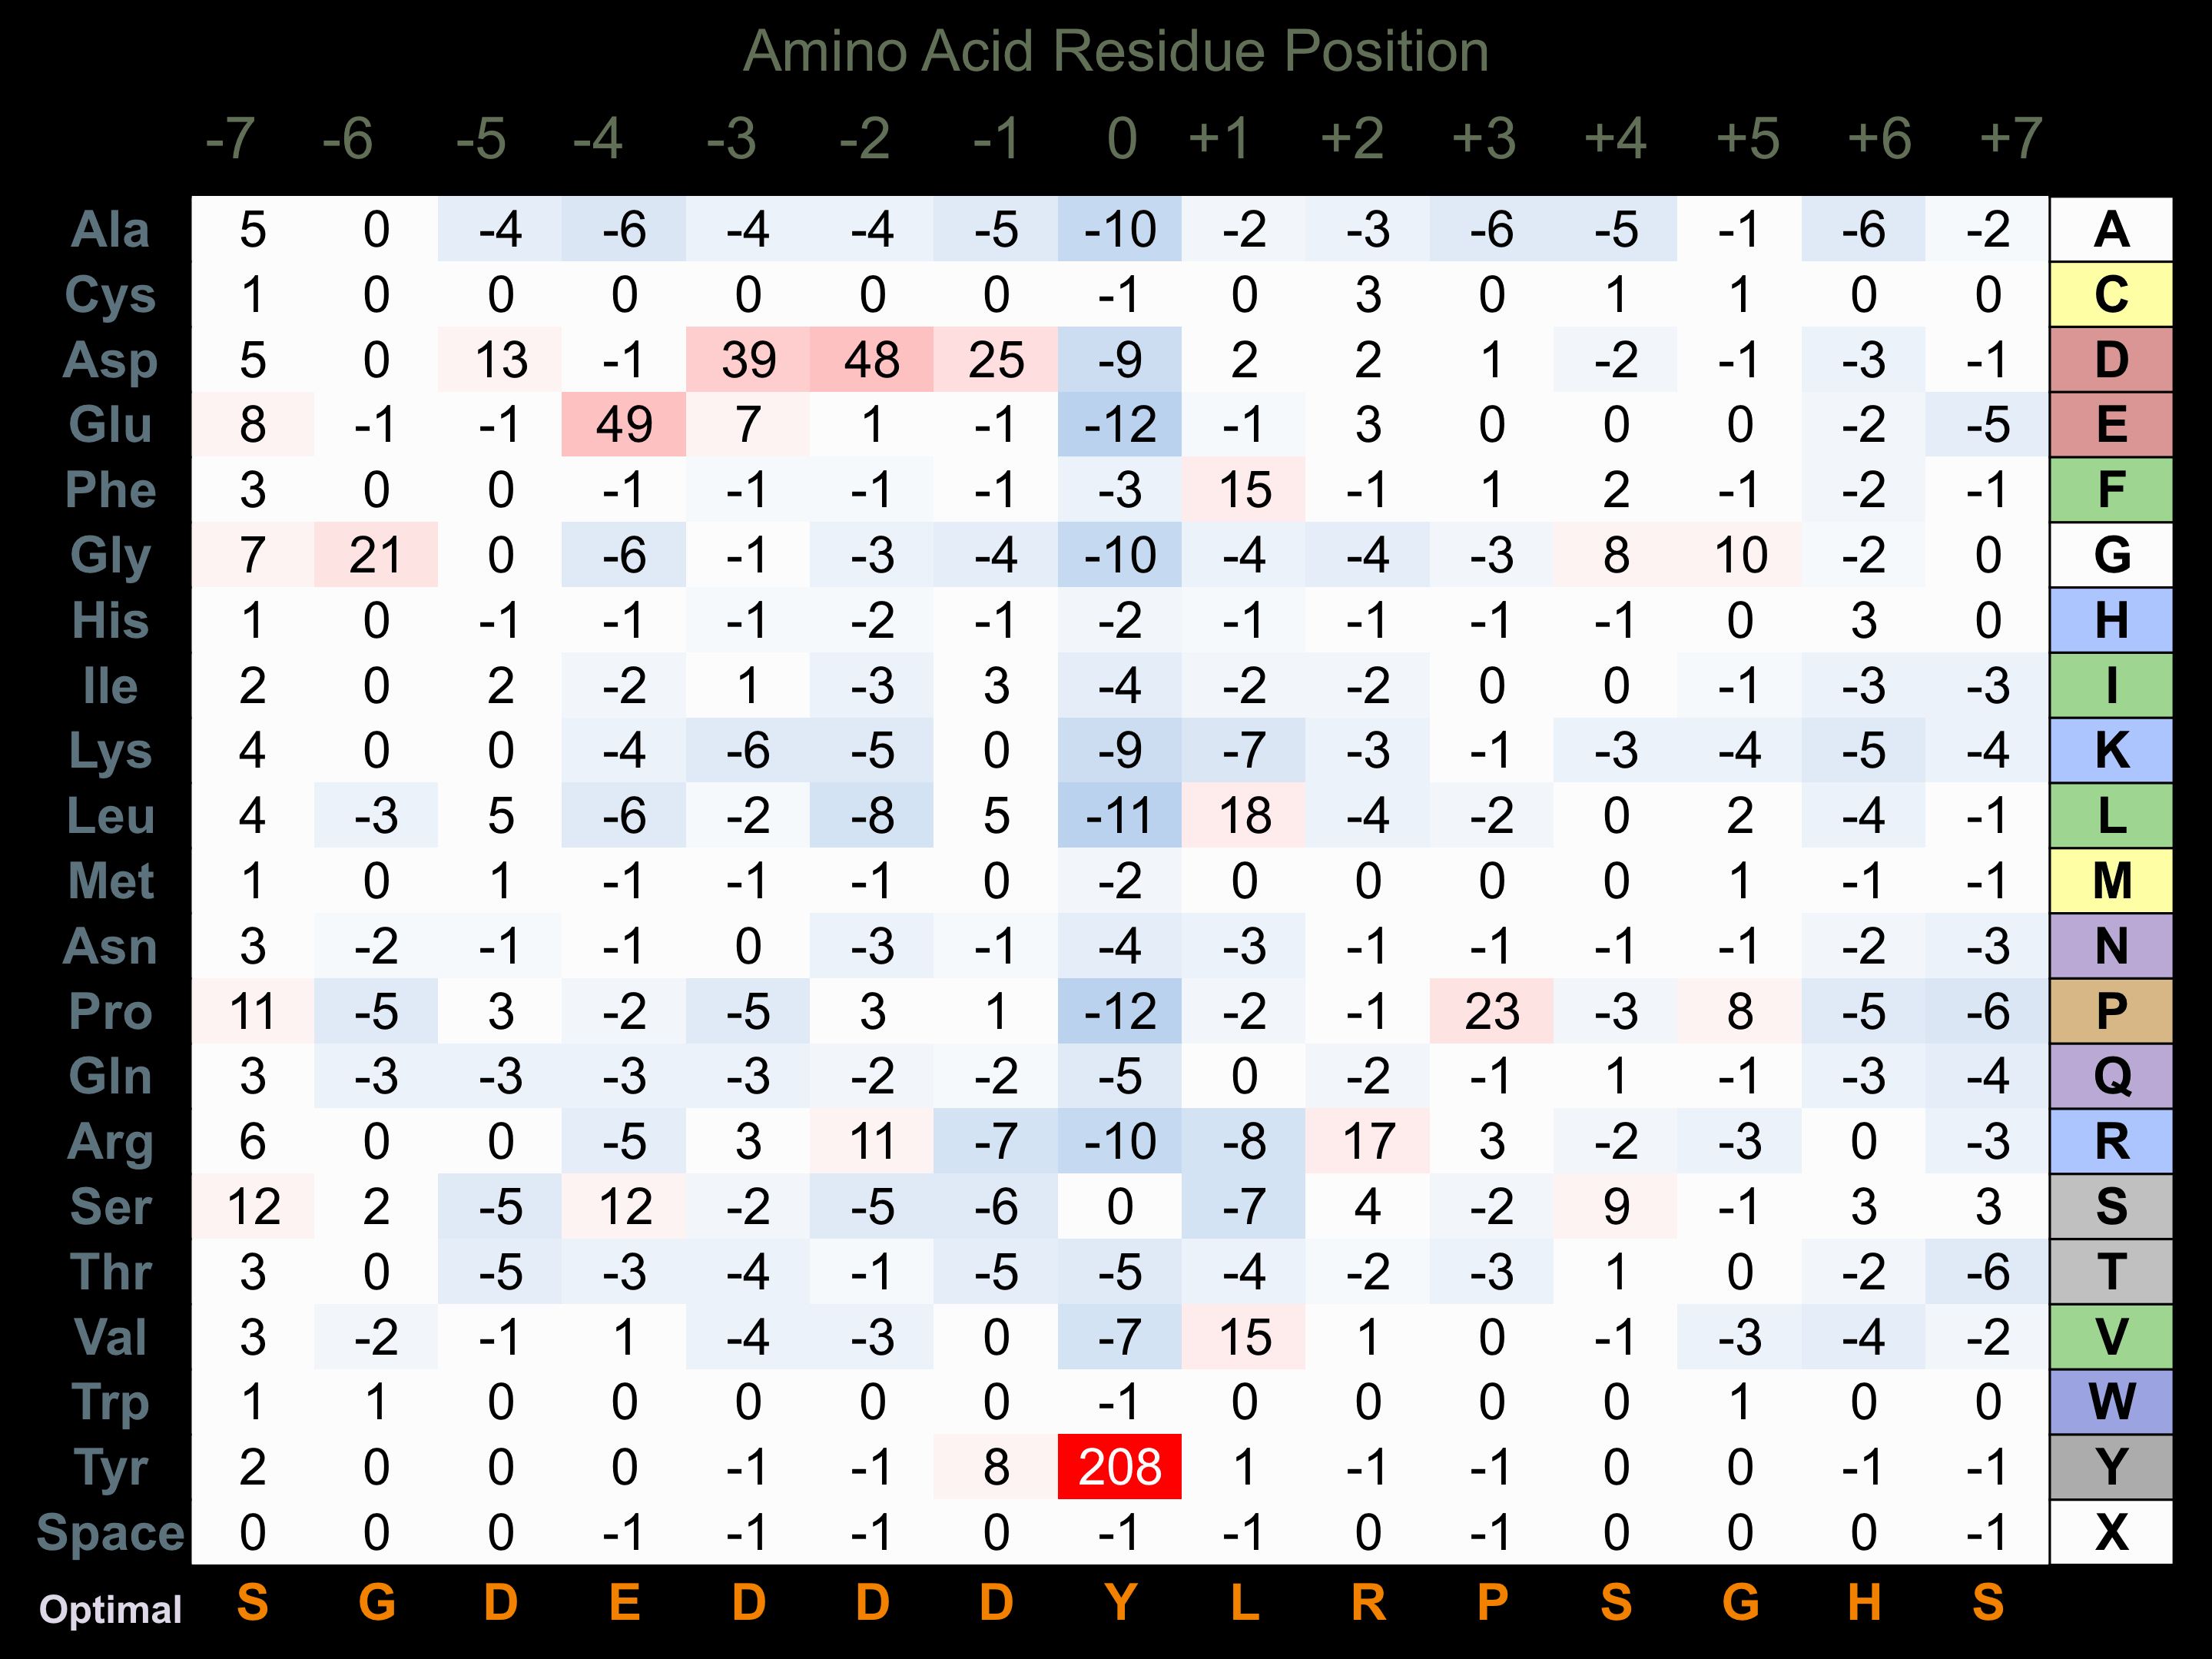
Protein Kinase Specificity
Matrix of observed frequency (%) of amino acids in aligned protein substrate phosphosites

Matrix Type:
Predicted from the application of the Kinexus Kinase Substrate Predictor Version 2.0 algorithm, which was trained with over 10,000 kinase-protein substrate pairs and 8,000 kinase-peptide substrate pairs.
Domain #:
1
Disease Linkage
General Disease Association:
Cancer
Specific Cancer Types:
Breast cancer
Comments:
Elevated expression of LMR3 in breast cancer specimens is associated with low survival rates, indicating a role for the protein in promoting cancer progression. In particular, LMR3 is highly expressed in triple-negative breast cancers and has been linked to the remodeling of the actin cytoskeleton, formation of focal adhesions, and promoting cell motility. In addition, overexpression of LMR3 in breast cancer cell lines leads to increased cell dispersal and migration, coinciding with increase actin protrusions and formation of focal adhesions on the leading edge of the mobile cells. Therefore, LMR3 expression is implicated in the promotion of metastasis as it increases the motility, dispersal, and invasive properties of breast cancer cells. Increased LMR3 expression is correlated with increased expression of integrin subunits alpha-5 and beta-1, which function as critical receptors for pro-metastatic signalling molecules. In animal studies, injection of breast cancer cells overexpressing LMR3 into mice results in extensive metastasis of the injected cells, confirming a role for LMR3 in the promotion of breast cancer metastasis and therefore in the progression of the disease.
Gene Expression in Cancers:
TranscriptoNET (www.transcriptonet.ca) analysis with mRNA expression data retrieved from the National Center for Biotechnology Information's Gene Expression Omnibus (GEO) database, which was normalized against 60 abundantly and commonly found proteins, indicated altered expression for this protein kinase as shown here as the percent change from normal tissue controls (%CFC) as supported with the Student T-test in human Ovary adenocarcinomas (%CFC= +91, p<0.075).
Mutagenesis Experiments:
Insertional mutagenesis studies in mice have not yet revealed a role for this protein kinase in mouse cancer oncogenesis.
Mutation Rate in All Cancers:
Percent mutation rates per 100 amino acids length in human cancers: 0.05 % in 24433 diverse cancer specimens. This rate is only -38 % lower than the average rate of 0.075 % calculated for human protein kinases in general.
Mutation Rate in Specific Cancers:
Highest percent mutation rates per 100 amino acids length in human cancers: 0.06 % in 942 upper aerodigestive tract cancers tested; 0.02 % in 864 skin cancers tested; 0.02 % in 1229 large intestine cancers tested;
Frequency of Mutated Sites:
Most frequent mutations with the number of reports indicated in brackets: D587A (8).
Comments:
Six deletions, 13 insertions and no complex mutations are noted on the COSMIC website.

