
Nomenclature
Short Name:
LTK
Full Name:
Leukocyte tyrosine kinase receptor
Alias:
- EC 2.7.1.112
- EC 2.7.10.1
- Protein tyrosine kinase-1
- TYK1
Classification
Type:
Protein-tyrosine kinase
Group:
TK
Family:
Alk
SubFamily:
NA

Specific Links
Structure
Mol. Mass (Da):
91681
# Amino Acids:
864
# mRNA Isoforms:
5
mRNA Isoforms:
91,681 Da (864 AA; P29376); 86,213 Da (803 AA; P29376-4); 78,714 Da (734 AA; P29376-5); 48,354 Da (477 AA; P29376-3); 21,952 Da (220 AA; P29376-2)
4D Structure:
NA
1D Structure:
Subfamily Alignment
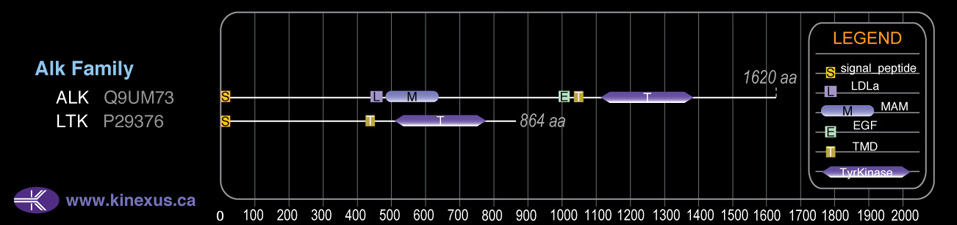
Domain Distribution:
| Start | End | Domain |
|---|---|---|
| 1 | 19 | signal_peptide |
| 426 | 448 | TMD |
| 510 | 777 | TyrKc |
| 510 | 791 | Pkinase |
Kinexus Products
Click on entries below for direct links to relevant products from Kinexus for this protein kinase.
hiddentext
Post-translation Modifications
For detailed information on phosphorylation of this kinase go to PhosphoNET
N-GlcNAcylated:
N257, N380, N412.
Serine phosphorylated:
S40, S259, S475.
Tyrosine phosphorylated:
Y672, Y676+, Y677.
Distribution
Based on gene microarray analysis from the NCBI
Human Tissue Distribution
% Max Expression:
Mean Expression:
Number of Samples:
Standard Deviation:
% Max Expression:
Mean Expression:
Number of Samples:
Standard Deviation:
 54
54
823
26
1097
 3
3
43
16
49
 3
3
50
20
46
 16
16
251
100
498
 25
25
377
24
357
 2
2
25
79
81
 27
27
415
35
719
 28
28
429
49
634
 16
16
243
17
176
 10
10
149
105
263
 3
3
51
43
57
 35
35
538
203
579
 2
2
28
42
21
 3
3
48
15
51
 5
5
73
36
113
 1
1
20
16
28
 8
8
122
211
64
 3
3
49
29
52
 2
2
34
101
33
 16
16
240
109
291
 3
3
40
34
43
 4
4
59
39
68
 5
5
82
38
104
 3
3
42
31
49
 4
4
64
34
71
 60
60
918
66
2222
 2
2
38
45
78
 3
3
46
30
62
 2
2
27
29
32
 11
11
171
28
153
 32
32
483
36
364
 100
100
1525
31
4746
 5
5
82
58
285
 38
38
579
62
582
 5
5
72
35
45
Evolution
Species Conservation
PhosphoNET % Identity:
PhosphoNET % Similarity:
Homologene %
Identity:
PhosphoNET % Identity:
PhosphoNET % Similarity:
Homologene %
Identity:
 100
100
100
100 23.3
23.3
38
99 71.8
71.8
74.2
94 -
-
-
- -
-
-
- 28.3
28.3
34.7
- -
-
-
- 77.3
77.3
83.1
79.5 52.8
52.8
55.7
82 -
-
-
- -
-
-
- 40.7
40.7
48.2
63 21.4
21.4
34.7
- 36.1
36.1
43.7
- -
-
-
- 23.2
23.2
32.3
- 26.5
26.5
37.7
- -
-
-
- -
-
-
- -
-
-
- -
-
-
- -
-
-
- -
-
-
- -
-
-
- -
-
-
-
For a wider analysis go to PhosphoNET Evolution in PhosphoNET
Binding Proteins
Examples of known interacting proteins
hiddentext
| No. | Name – UniProt ID |
|---|---|
| 1 | PIK3R1 - P27986 |
| 2 | PTPN1 - P18031 |
| 3 | PIK3C2B - O00750 |
| 4 | RAF1 - P04049 |
| 5 | PLCG1 - P19174 |
| 6 | SHC1 - P29353 |
| 7 | CBL - P22681 |
Regulation
Activation:
NA
Inhibition:
NA
Synthesis:
NA
Degradation:
NA
Protein Kinase Specificity
Matrix of observed frequency (%) of amino acids in aligned protein substrate phosphosites
Matrix Type:
Predicted from the application of the Kinexus Kinase Substrate Predictor Version 2.0 algorithm, which was trained with over 10,000 kinase-protein substrate pairs and 8,000 kinase-peptide substrate pairs.
Domain #:
1
Inhibitors
For further details on these inhibitors click on the Compound Name and enter it into DrugKiNET or click on the ID's
Based on in vitro and/or in vivo phosphorylation data
| Compound Name | KD, Ki or IC50 (nM) | PubChem ID | ChEMBL ID | PubMed ID |
|---|
Disease Linkage
General Disease Association:
Autoimmune disorder
Specific Diseases (Non-cancerous):
Systemic lupus erythematosus (SLE)
Comments:
Over-expression of LTK has been linked to Systemic Lupus Erythematosus (SLE). This autoimmune disorder results from the proliferation of self-recognizing B-cells which have a multitude of reactions, but commonly affect kidney tissue. A proposed mechanism is that a gain of function mutation, YXXM, on LTK where the p85 subunit (of PI3KR1) binds. It was proposed that this mutation leads to increased PI3K signalling and self-reactive B cells. The K544M mutation results in loss of LTK interaction with PLCG1, p85, Ras GTPase, or Raf1. Increased p85 association and autophosphorylation of LTK has been observed with a G750E mutation. Apoptosis has been induced with a Y753F mutation causing impaired p85 binding and inhibited PI3K kinase phosphotransferase activity. CBLC phosphorylation has been inhibited with a Y862F mutation.
Gene Expression in Cancers:
TranscriptoNET (www.transcriptonet.ca) analysis with mRNA expression data retrieved from the National Center for Biotechnology Information's Gene Expression Omnibus (GEO) database, which was normalized against 60 abundantly and commonly found proteins, indicated altered expression for this protein kinase as shown here as the percent change from normal tissue controls (%CFC) as supported with the Student T-test in human Bladder carcinomas (%CFC= -48, p<0.0001). The COSMIC website notes an up-regulated expression score for LTK in diverse human cancers of 343, which is 0.7-fold of the average score of 462 for the human protein kinases. The down-regulated expression score of 0 for this protein kinase in human cancers was 100% lower than the average score of 60 for the human protein kinases.
Mutagenesis Experiments:
Insertional mutagenesis studies in mice have not yet revealed a role for this protein kinase in mouse cancer oncogenesis.
Mutation Rate in All Cancers:
Percent mutation rates per 100 amino acids length in human cancers: 0.05 % in 25553 diverse cancer specimens. This rate is only -38 % lower than the average rate of 0.075 % calculated for human protein kinases in general.
Mutation Rate in Specific Cancers:
Highest percent mutation rates per 100 amino acids length in human cancers: 0.23 % in 805 skin cancers tested; 0.19 % in 1093 large intestine cancers tested; 0.1 % in 1941 lung cancers tested.
Frequency of Mutated Sites:
Most frequent mutations with the number of reports indicated in brackets: R617P (3).
Comments:
Only 2 deletions, and no insertions or complex mutations are noted on the COSMIC website.