
Nomenclature
Short Name:
LZK
Full Name:
Mitogen-activated protein kinase kinase kinase 13
Alias:
- Mixed lineage kinase
- MLK
- Leucine zipper-bearing kinase
- LZK
- MAP3K13
Classification
Type:
Protein-serine/threonine kinase
Group:
TKL
Family:
MLK
SubFamily:
LZK

Structure
Mol. Mass (Da):
108,296
# Amino Acids:
966
# mRNA Isoforms:
5
mRNA Isoforms:
108,296 Da (966 AA; O43283); 92,654 Da (822 AA; O43283-4); 85,404 Da (759 AA; O43283-5); 17,575 Da (160 AA; O43283-3); 14,073 Da (128 AA; O43283-6)
4D Structure:
Homodimer; forms dimers through the leucine-zipper motif. Interacts with the C-terminus of MAPK8IP1 through the kinase catalytic domain. Binds PRDX3. Associates with the IKK complex through the kinase domain
1D Structure:
Subfamily Alignment

Domain Distribution:
| Start | End | Domain |
|---|---|---|
| 168 | 409 | Pkinase |
| 457 | 496 | Coiled-coil |
| 433 | 454 | Leucine-zipper 1 |
| 486 | 507 | Leucine-zipper 2 |
Post-translation Modifications
For detailed information on phosphorylation of this kinase go to PhosphoNET
Acetylated:
K502.
Methylated:
K541.
Serine phosphorylated:
S282, S567, S578, S579, S789, S811.
Threonine phosphorylated:
T288.
Tyrosine phosphorylated:
Y483, Y511.
Distribution
Based on gene microarray analysis from the NCBI
Human Tissue Distribution
% Max Expression:
Mean Expression:
Number of Samples:
Standard Deviation:
% Max Expression:
Mean Expression:
Number of Samples:
Standard Deviation:
 38
38
812
35
1028
 2
2
44
16
42
 2
2
47
14
32
 8
8
171
114
342
 26
26
547
27
348
 0.5
0.5
11
83
14
 10
10
221
45
417
 14
14
301
41
445
 28
28
588
17
520
 3
3
62
96
66
 2
2
51
35
49
 23
23
484
192
540
 0.8
0.8
17
36
20
 1
1
21
12
20
 4
4
87
29
85
 1
1
23
20
24
 1
1
21
208
21
 3
3
59
25
42
 0.4
0.4
8
95
10
 17
17
369
132
389
 2
2
33
27
30
 0.6
0.6
13
32
12
 3
3
62
16
43
 2
2
39
23
38
 1
1
24
27
25
 19
19
404
71
440
 0.9
0.9
19
39
23
 3
3
57
23
45
 1
1
29
23
23
 1
1
21
28
13
 11
11
233
24
237
 100
100
2135
41
5292
 16
16
349
73
778
 30
30
648
78
581
 4
4
77
48
69
Evolution
Species Conservation
PhosphoNET % Identity:
PhosphoNET % Similarity:
Homologene %
Identity:
PhosphoNET % Identity:
PhosphoNET % Similarity:
Homologene %
Identity:
 100
100
100
100 98.9
98.9
99.3
99 50.8
50.8
63.7
99 -
-
-
94 -
-
-
97 50.8
50.8
63.4
93 -
-
-
- 88.7
88.7
93.2
89 50
50
63.4
88 -
-
-
- 46
46
47.8
- -
-
-
82 69.2
69.2
78.9
75 67.9
67.9
76.3
74 -
-
-
- 23.7
23.7
40
39 35.9
35.9
52.2
- 27.4
27.4
44
- 37
37
53.2
- -
-
-
- -
-
-
- -
-
-
- -
-
-
- -
-
-
- -
-
-
-
For a wider analysis go to PhosphoNET Evolution in PhosphoNET
Binding Proteins
Examples of known interacting proteins
hiddentext
| No. | Name – UniProt ID |
|---|---|
| 1 | MAPK8IP1 - Q9UQF2 |
| 2 | IKBKB - O14920 |
| 3 | PRDX3 - P30048 |
Regulation
Activation:
Activated by autophosphorylation and homodimerization.
Inhibition:
NA
Synthesis:
NA
Degradation:
NA
Protein Kinase Specificity
Matrix of observed frequency (%) of amino acids in aligned protein substrate phosphosites
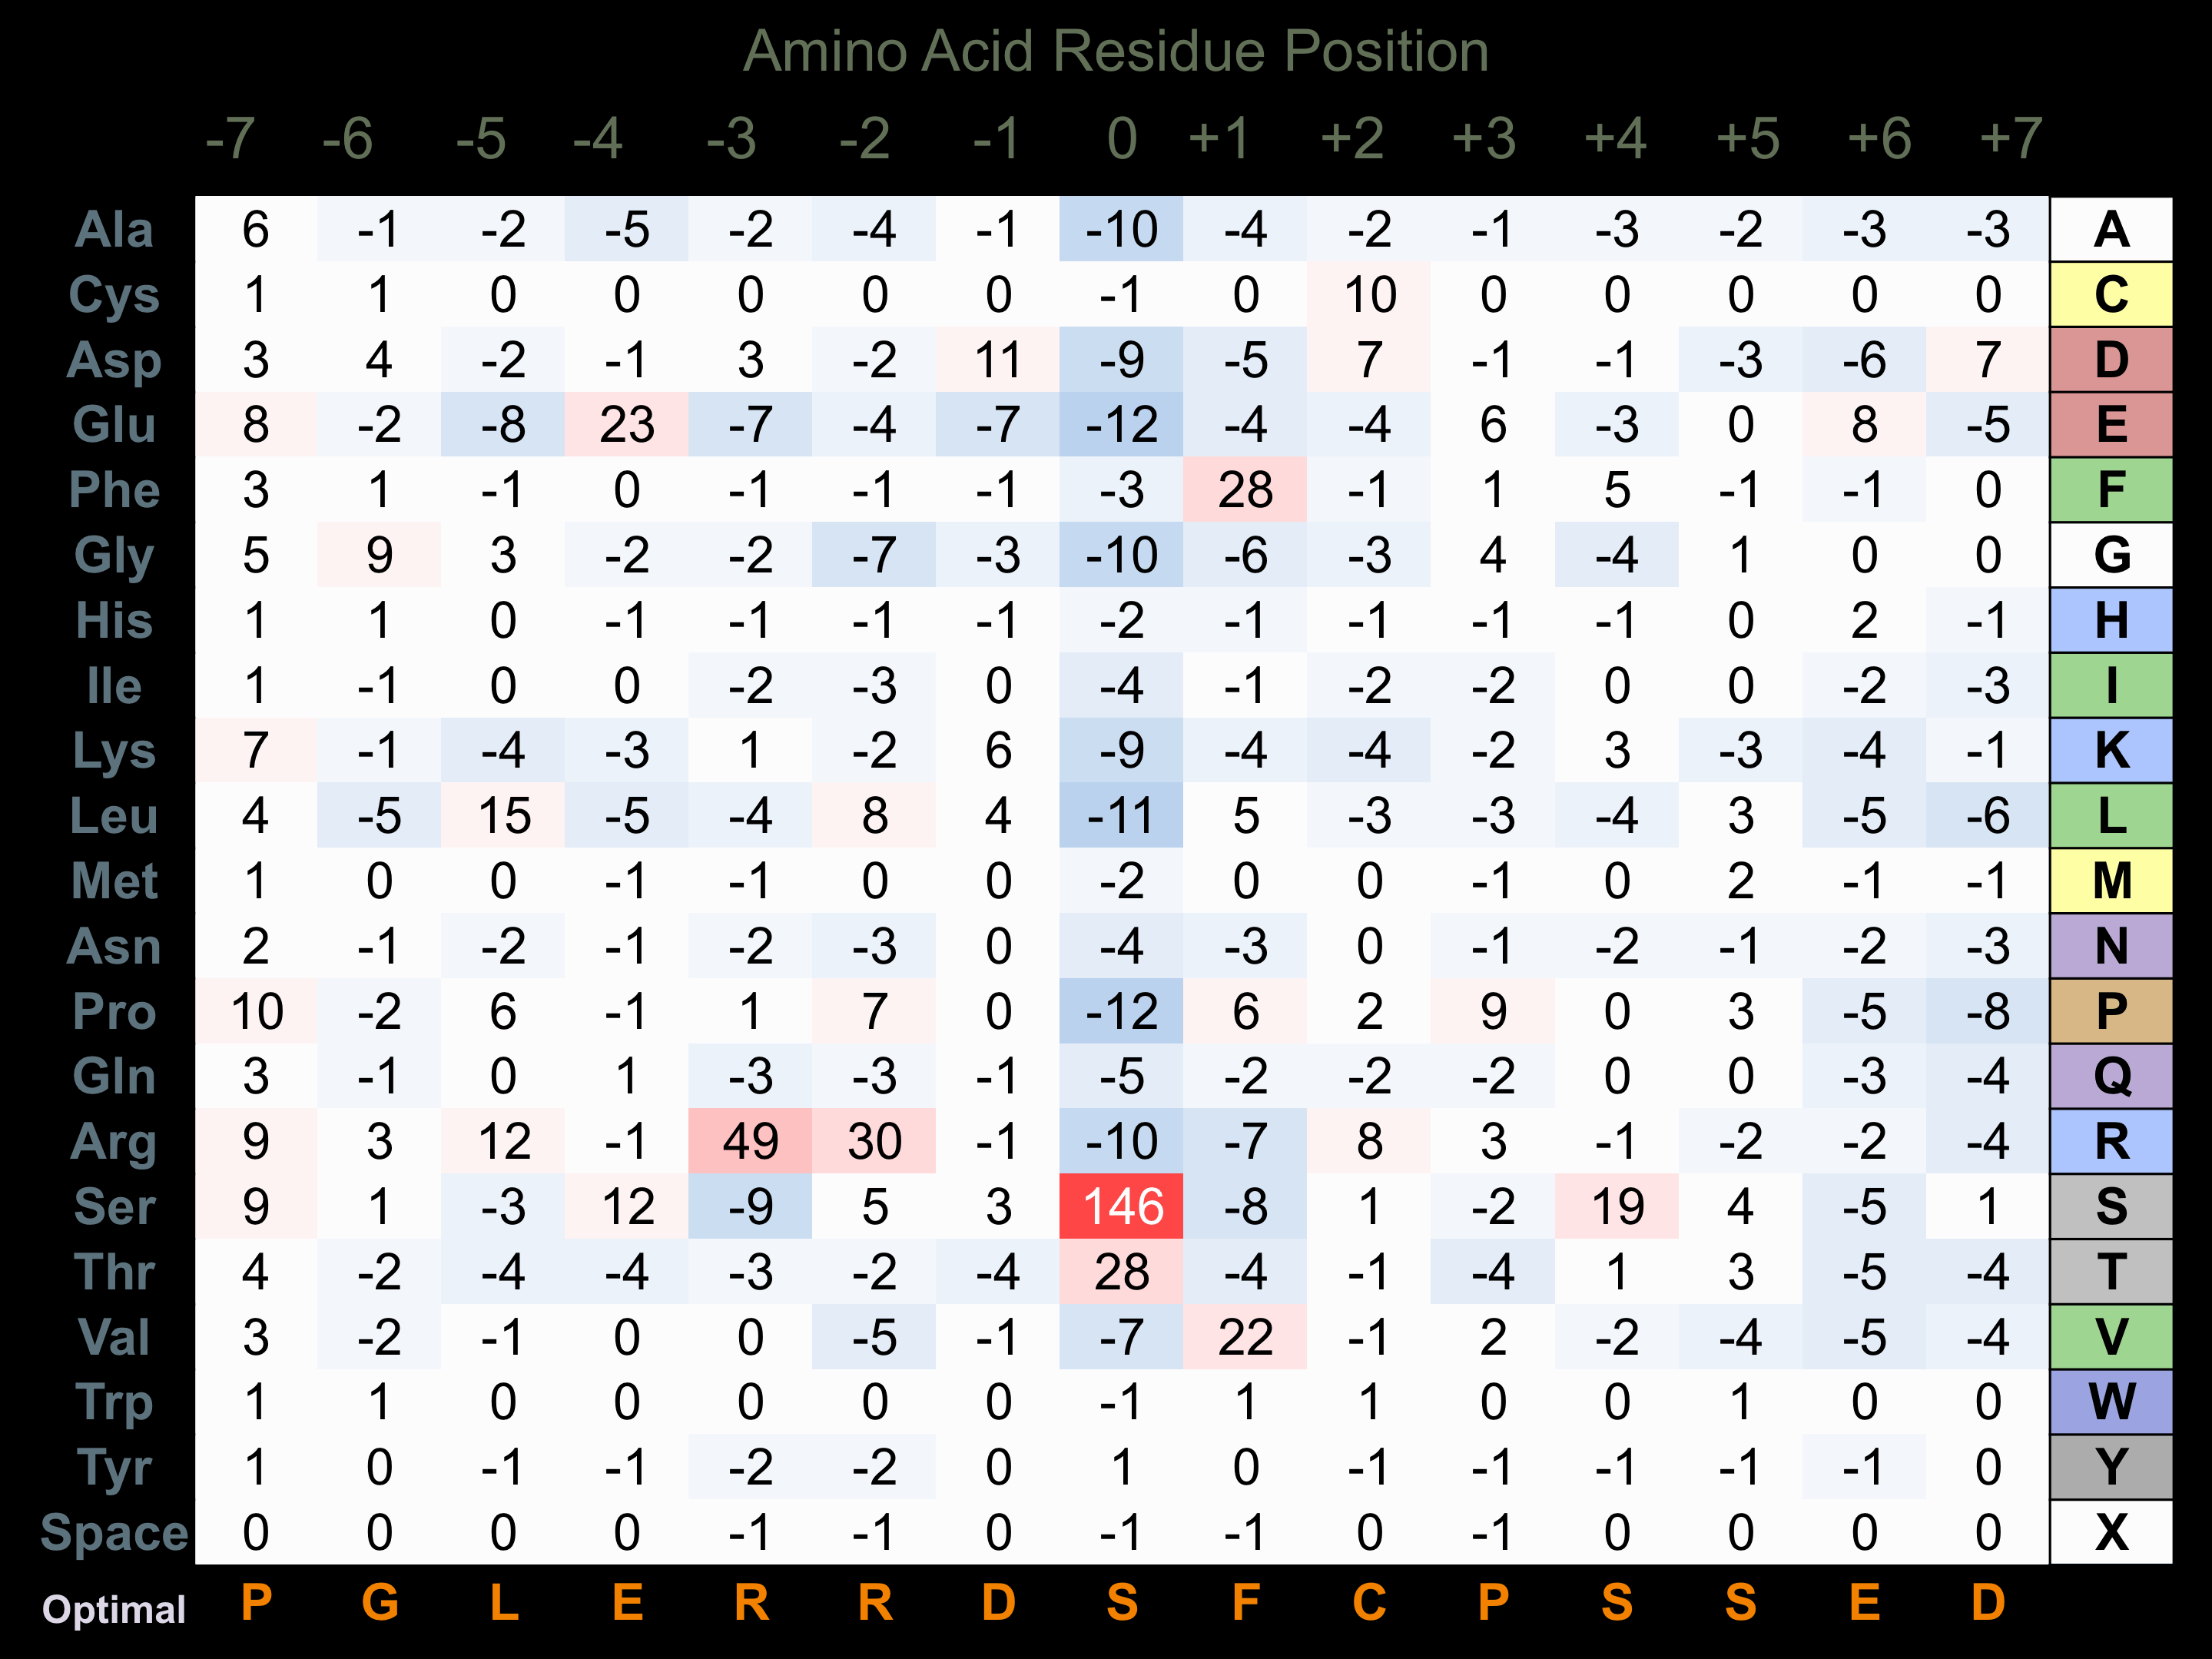
Matrix Type:
Predicted from the application of the Kinexus Kinase Substrate Predictor Version 2.0 algorithm, which was trained with over 10,000 kinase-protein substrate pairs and 8,000 kinase-peptide substrate pairs.
Domain #:
1
Inhibitors
For further details on these inhibitors click on the Compound Name and enter it into DrugKiNET or click on the ID's
Based on in vitro and/or in vivo phosphorylation data
| Compound Name | KD, Ki or IC50 (nM) | PubChem ID | ChEMBL ID | PubMed ID |
|---|
| Sunitinib | Kd = 95 nM | 5329102 | 535 | 19654408 |
| Tozasertib | Kd = 180 nM | 5494449 | 572878 | 22037378 |
| Lestaurtinib | Kd = 340 nM | 126565 | 22037378 | |
| KW2449 | Kd = 500 nM | 11427553 | 1908397 | 22037378 |
| Neratinib | Kd = 740 nM | 9915743 | 180022 | 22037378 |
| N-Benzoylstaurosporine | Kd = 2.8 µM | 56603681 | 608533 | 19654408 |
| PHA-665752 | Kd = 3.2 µM | 10461815 | 450786 | 22037378 |
Disease Linkage
Gene Expression in Cancers:
The COSMIC website notes an up-regulated expression score for LZK in diverse human cancers of 596, which is 1.3-fold of the average score of 462 for the human protein kinases. The down-regulated expression score of 5 for this protein kinase in human cancers was 0.1-fold of the average score of 60 for the human protein kinases.
Mutagenesis Experiments:
Insertional mutagenesis studies in mice have not yet revealed a role for this protein kinase in mouse cancer oncogenesis.
Mutation Rate in All Cancers:
Percent mutation rates per 100 amino acids length in human cancers: 0.08 % in 24965 diverse cancer specimens. This rate is very similar (+ 7% higher) to the average rate of 0.075 % calculated for human protein kinases in general.
Mutation Rate in Specific Cancers:
Highest percent mutation rates per 100 amino acids length in human cancers: 0.36 % in 805 skin cancers tested; 0.36 % in 1093 large intestine cancers tested; 0.23 % in 500 urinary tract cancers tested; 0.22 % in 602 endometrium cancers tested; 0.18 % in 589 stomach cancers tested; 0.11 % in 1292 breast cancers tested; 0.1 % in 1808 lung cancers tested.
Frequency of Mutated Sites:
None >4 in 20224 cancer specimens
Comments:
Only 6 deletions, 1 insertion and no complex mutations are noted on the COSMIC website.