
Nomenclature
Short Name:
MAPKAPK3
Full Name:
Mitogen activated protein kinase activated protein kinase-3
Alias:
- 3PK
- 54r
- Similar to mitogen-activated protein kinase-activated protein kinase 3
- EC 2.7.11.1
- MAPK3
- MAPKAP3
- Mitogen activated protein kinase activated protein kinase-3
Classification
Type:
Protein-serine/threonine kinase
Group:
CAMK
Family:
MAPKAPK
SubFamily:
MAPKAPK

Specific Links
Structure
Mol. Mass (Da):
42,987
# Amino Acids:
382
# mRNA Isoforms:
1
mRNA Isoforms:
42,987 Da (382 AA; Q16644)
4D Structure:
Interacts with TCF3 and with polycomb proteins, such as PCH2 and BMI1/PCGF4
1D Structure:
3D Image (rendered using PV Viewer):
PDB ID
Subfamily Alignment
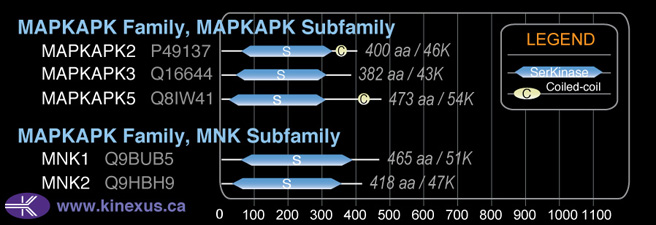
Domain Distribution:
| Start | End | Domain |
|---|---|---|
| 44 | 304 | Pkinase |
Kinexus Products
Click on entries below for direct links to relevant products from Kinexus for this protein kinase.
hiddentext
Post-translation Modifications
For detailed information on phosphorylation of this kinase go to PhosphoNET
Acetylated:
M1, K177, K179, K332, .
Serine phosphorylated:
S244, S251, S307, S372, S373, S374, S376.
Threonine phosphorylated:
T5, T201+, T205-, T246, T313, T317.
Tyrosine phosphorylated:
Y43, Y76, Y204-, Y207-, Y208-, Y346.
Distribution
Based on gene microarray analysis from the NCBI
Human Tissue Distribution
% Max Expression:
Mean Expression:
Number of Samples:
Standard Deviation:
% Max Expression:
Mean Expression:
Number of Samples:
Standard Deviation:
 56
56
963
29
1023
 19
19
320
18
233
 6
6
100
13
94
 39
39
660
105
1556
 54
54
922
25
707
 6
6
100
77
77
 30
30
505
39
631
 85
85
1452
55
1226
 52
52
887
17
558
 15
15
262
114
180
 8
8
139
41
113
 39
39
671
222
684
 8
8
130
35
95
 5
5
91
16
47
 12
12
197
36
169
 11
11
196
16
115
 12
12
212
295
2070
 14
14
232
25
280
 30
30
516
103
530
 44
44
746
109
676
 9
9
156
32
111
 11
11
190
37
142
 8
8
130
23
130
 6
6
98
24
80
 15
15
263
33
223
 44
44
749
66
782
 11
11
196
38
200
 9
9
150
25
103
 6
6
103
25
78
 22
22
383
28
101
 58
58
993
24
884
 100
100
1708
42
2218
 12
12
197
74
247
 63
63
1073
57
743
 20
20
345
35
199
Evolution
Species Conservation
PhosphoNET % Identity:
PhosphoNET % Similarity:
Homologene %
Identity:
PhosphoNET % Identity:
PhosphoNET % Similarity:
Homologene %
Identity:
 100
100
100
100 99.5
99.5
99.7
99.5 99.2
99.2
99.5
99 -
-
-
96 -
-
-
93 79.7
79.7
81.3
95.5 -
-
-
- 94.3
94.3
96.1
93 93.2
93.2
95.3
93.5 -
-
-
- 61.3
61.3
72
- 21.2
21.2
30.3
91 67.3
67.3
79.1
81 70.8
70.8
80.9
79.5 -
-
-
- 58.4
58.4
71.5
65 -
-
-
- -
-
-
59 -
-
-
- -
-
-
- -
-
-
- -
-
-
- -
-
-
- -
-
-
- -
-
-
-
For a wider analysis go to PhosphoNET Evolution in PhosphoNET
Binding Proteins
Examples of known interacting proteins
hiddentext
| No. | Name – UniProt ID |
|---|---|
| 1 | HSPB1 - P04792 |
| 2 | TCF3 - P15923 |
| 3 | MAPK14 - Q16539 |
| 4 | EEF2K - O00418 |
| 5 | EEF2 - P13639 |
Regulation
Activation:
NA
Inhibition:
NA
Synthesis:
NA
Degradation:
NA
Known Upstream Kinases
For further details on these substrates click on the Substrate Short Name or UniProt ID. Phosphosite Location is hyperlinked to PhosphoNET
predictions.
Based on in vitro and/or in vivo phosphorylation data
| Kinase Short Name | UniProt ID (Human) | Phosphosite Location | Phosphosite Sequence | Effect of Phosphorylation |
|---|
Known Downstream Substrates
For further details on these substrates click on the Substrate Short Name or UniProt ID. Phosphosite Location is hyperlinked to PhosphoNET
predictions.
Based on in vitro and/or in vivo phosphorylation data
| Substrate Short Name | UniProt ID (Human) | Phosphosite Location | Phosphosite Sequence | Effect of Phosphorylation |
|---|
Protein Kinase Specificity
Matrix of observed frequency (%) of amino acids in aligned protein substrate phosphosites
Matrix Type:
Predicted from the application of the Kinexus Kinase Substrate Predictor Version 2.0 algorithm, which was trained with over 10,000 kinase-protein substrate pairs and 8,000 kinase-peptide substrate pairs.
Domain #:
1
Inhibitors
For further details on these inhibitors click on the Compound Name and enter it into DrugKiNET or click on the ID's
Based on in vitro and/or in vivo phosphorylation data
| Compound Name | KD, Ki or IC50 (nM) | PubChem ID | ChEMBL ID | PubMed ID |
|---|
Disease Linkage
General Disease Association:
Cancer
Specific Cancer Types:
Lung cancer (LC)
Comments:
MAPKAPK3 might be a tumour suppressor protein (TSP). It is proposed to be deleted in some small cell lung cancers, but this remains to be proven in an in vivo (and not only cell line) model.
Gene Expression in Cancers:
TranscriptoNET (www.transcriptonet.ca) analysis with mRNA expression data retrieved from the National Center for Biotechnology Information's Gene Expression Omnibus (GEO) database, which was normalized against 60 abundantly and commonly found proteins, indicated altered expression for this protein kinase as shown here as the percent change from normal tissue controls (%CFC) as supported with the Student T-test in the following types of human cancers: Brain glioblastomas (%CFC= -70, p<0.015); Cervical cancer (%CFC= +64, p<0.048); Cervical cancer stage 2B (%CFC= +111); Classical Hodgkin lymphomas (%CFC= +156, p<0.002); Large B-cell lymphomas (%CFC= +131, p<0.002); Oral squamous cell carcinomas (OSCC) (%CFC= -45, p<0.003); and Ovary adenocarcinomas (%CFC= +52, p<0.083).
Mutagenesis Experiments:
Insertional mutagenesis studies in mice have not yet revealed a role for this protein kinase in mouse cancer oncogenesis. MAPKAPK3 affinity to PCH2 can be increased with a K73M mutation.
Mutation Rate in All Cancers:
Percent mutation rates per 100 amino acids length in human cancers: 0.06 % in 24434 diverse cancer specimens. This rate is only -15 % lower than the average rate of 0.075 % calculated for human protein kinases in general.
Mutation Rate in Specific Cancers:
Highest percent mutation rates per 100 amino acids length in human cancers: 0.32 % in 1052 large intestine cancers tested.
Frequency of Mutated Sites:
None > 3 in 24,434 cancer specimens
Comments:
Only 4 deletions (3 at R31fs*9) and 3 deletions (all at R31fs*9), and no complex mutations are noted on the COSMIC website.