
Nomenclature
Short Name:
MARK4
Full Name:
MAP-microtubule affinity-regulating kinase 4
Alias:
- FLJ90097
- KIAA1860
- Kinase MARK4
- MARKL1
- MARKL1, EC 2.7.11.1
- Nbla00650
Classification
Type:
Protein-serine/threonine kinase
Group:
CAMK
Family:
CAMKL
SubFamily:
MARK

Specific Links
Structure
Mol. Mass (Da):
82,520
# Amino Acids:
752
# mRNA Isoforms:
2
mRNA Isoforms:
82,520 Da (752 AA; Q96L34); 75,321 Da (688 AA; Q96L34-2)
4D Structure:
NA
1D Structure:
Subfamily Alignment
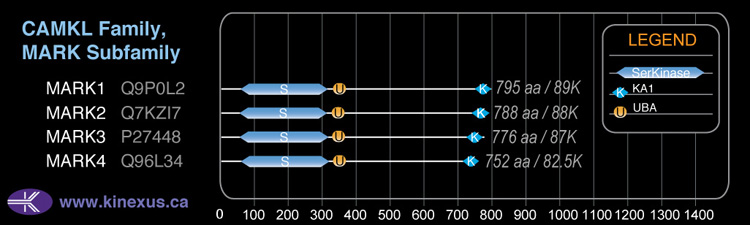
Domain Distribution:
Kinexus Products
Click on entries below for direct links to relevant products from Kinexus for this protein kinase.
hiddentext
Post-translation Modifications
For detailed information on phosphorylation of this kinase go to PhosphoNET
Methylated:
R60.
Serine phosphorylated:
S15, S23, S26, S45, S48, S218-, S344, S391, S404, S423, S438, S441, S496, S504, S543, S545, S546, S563, S567, S594.
Threonine phosphorylated:
T17, T20, T64, T214+, T393, T394, T440, T442, T507, T511, T564, T568.
Ubiquitinated:
K183.
Distribution
Based on gene microarray analysis from the NCBI
Human Tissue Distribution
% Max Expression:
Mean Expression:
Number of Samples:
Standard Deviation:
% Max Expression:
Mean Expression:
Number of Samples:
Standard Deviation:
 71
71
893
29
1039
 10
10
122
13
69
 9
9
119
19
127
 44
44
551
96
576
 70
70
882
24
689
 6
6
79
74
70
 3
3
35
27
25
 59
59
744
45
1304
 35
35
434
17
339
 9
9
116
78
199
 14
14
173
36
292
 61
61
764
149
679
 5
5
62
41
56
 6
6
80
9
94
 9
9
119
29
150
 9
9
119
14
74
 21
21
265
101
181
 17
17
212
26
323
 7
7
90
88
83
 59
59
741
109
690
 11
11
132
28
127
 11
11
142
32
224
 30
30
383
21
1212
 21
21
258
26
283
 17
17
212
28
332
 54
54
679
61
1055
 7
7
91
44
103
 17
17
217
26
658
 10
10
123
26
119
 16
16
195
28
74
 27
27
336
24
276
 100
100
1256
36
1570
 3
3
36
34
34
 74
74
934
52
762
 6
6
76
35
60
Evolution
Species Conservation
PhosphoNET % Identity:
PhosphoNET % Similarity:
Homologene %
Identity:
PhosphoNET % Identity:
PhosphoNET % Similarity:
Homologene %
Identity:
 100
100
100
100 93.8
93.8
94.4
100 75.8
75.8
77.9
98 -
-
-
99 -
-
-
98 88.4
88.4
89.3
98 -
-
-
- 97.6
97.6
98.9
98 60.4
60.4
73.5
98 -
-
-
- 64.4
64.4
77.3
- 32.4
32.4
50
- -
-
-
74 29.3
29.3
41.2
75 -
-
-
- -
-
-
- -
-
-
- 34.8
34.8
46.9
- -
-
-
- -
-
-
- -
-
-
- -
-
-
- 27.5
27.5
43.8
- 27.7
27.7
44.6
- -
-
-
-
For a wider analysis go to PhosphoNET Evolution in PhosphoNET
Binding Proteins
Examples of known interacting proteins
hiddentext
| No. | Name – UniProt ID |
|---|---|
| 1 | TUBA4A - P68366 |
| 2 | MAP2 - P11137 |
| 3 | MYH9 - P35579 |
| 4 | MAPT - P10636 |
| 5 | TUBB - P07437 |
| 6 | MYH10 - P35580 |
| 7 | ACTA1 - P68133 |
| 8 | TUBB2A - Q13885 |
| 9 | TUBA1A - Q71U36 |
| 10 | MAP4 - P27816 |
| 11 | TUBG1 - P23258 |
| 12 | HSPA4 - P34932 |
| 13 | HGS - O14964 |
| 14 | NUAK1 - O60285 |
| 15 | YWHAE - P62258 |
Regulation
Activation:
NA
Inhibition:
NA
Synthesis:
NA
Degradation:
NA
Known Upstream Kinases
For further details on these substrates click on the Substrate Short Name or UniProt ID. Phosphosite Location is hyperlinked to PhosphoNET
predictions.
Based on in vitro and/or in vivo phosphorylation data
| Kinase Short Name | UniProt ID (Human) | Phosphosite Location | Phosphosite Sequence | Effect of Phosphorylation |
|---|
Protein Kinase Specificity
Matrix of observed frequency (%) of amino acids in aligned protein substrate phosphosites
Matrix Type:
Predicted from the application of the Kinexus Kinase Substrate Predictor Version 2.0 algorithm, which was trained with over 10,000 kinase-protein substrate pairs and 8,000 kinase-peptide substrate pairs.
Domain #:
1
Inhibitors
For further details on these inhibitors click on the Compound Name and enter it into DrugKiNET or click on the ID's
Based on in vitro and/or in vivo phosphorylation data
| Compound Name | KD, Ki or IC50 (nM) | PubChem ID | ChEMBL ID | PubMed ID |
|---|
Disease Linkage
General Disease Association:
Neurological disorders
Specific Diseases (Non-cancerous):
Alzheimer's disease (AD)
Comments:
Alzheimer's disease (AD) is a neurodegenerative disease characterized by the progressive loss of memory, judgement, and other cognitive processes. The hallmark of AD pathology is the deposition of amyloid-beta plaques and tau tangles. These abnormalities are implicated in the disruption of cellular communication, oxidative cell damage, and eventual cell death. Multiple genes are thought to contribute to AD suceptibility along with epigenetic and environmental factors. In general, MARK proteins have been implicated in the phosphorylation of the tau protein at the Ser-262 residue. This phosphorylation event is predicted to induce the dissociation of the tau protein from the microtubules, thus exposing more phosphosites for other kinases to phosphorylate and leading to the deposition of hyperphosphorylated tau proteins and the formation of neurofibrillary bundles. In addition, beta-amyloid can influence tau phosphorylation through the modulation of MARK catalytic activity, thus the MARK proteins may represent a functional link between beta-amyloid and tau in the pathogenesis of AD. Of the MARK proteins, MARK4 has been shown to be the most important for endogenous phosphorylation of the tau protein. In addition, post-mortem analysis of brain tissue from AD patients revealed signficantly elevated MARK4 expression and strong interactions between MARK4 and tau, thus further implicating the protein in the pathogenesis of AD. In animal studies, overexpression of MARK4 in rat hippocampal neurons lead to tau hyper-phosphorylation, correlated with significant dendritic spine and synaptic loss.
Gene Expression in Cancers:
TranscriptoNET (www.transcriptonet.ca) analysis with mRNA expression data retrieved from the National Center for Biotechnology Information's Gene Expression Omnibus (GEO) database, which was normalized against 60 abundantly and commonly found proteins, indicated altered expression for this protein kinase as shown here as the percent change from normal tissue controls (%CFC) as supported with the Student T-test in the following types of human cancers: Colorectal adenocarcinomas (early onset) (%CFC= +100, p<(0.0003); and Ovary adenocarcinomas (%CFC= +95, p<0.022). The COSMIC website notes an up-regulated expression score for MARK4 in diverse human cancers of 581, which is 1.3-fold of the average score of 462 for the human protein kinases. The down-regulated expression score of 54 for this protein kinase in human cancers was 0.9-fold of the average score of 60 for the human protein kinases.
Mutagenesis Experiments:
Insertional mutagenesis studies in mice have not yet revealed a role for this protein kinase in mouse cancer oncogenesis.
Mutation Rate in All Cancers:
Percent mutation rates per 100 amino acids length in human cancers: 0.07 % in 24752 diverse cancer specimens. This rate is only -2 % lower and is very similar to the average rate of 0.075 % calculated for human protein kinases in general.
Mutation Rate in Specific Cancers:
Highest percent mutation rates per 100 amino acids length in human cancers: 0.51 % in 1093 large intestine cancers tested; 0.1 % in 1620 lung cancers tested.
Frequency of Mutated Sites:
None > 5 in 20,035 cancer specimens
Comments:
Only 6 deletions, 1 insertion and no complex mutations are noted on the COSMIC website.