
Nomenclature
Short Name:
MAST1
Full Name:
Microtubule-associated serine-threonine-protein kinase 1
Alias:
- EC 2.7.11.1
- KIAA0973
- Microtubule associated serine/threonine kinase 1
- SAST
Classification
Type:
Protein-serine/threonine kinase
Group:
AGC
Family:
MAST
SubFamily:
NA

Structure
Mol. Mass (Da):
170,677
# Amino Acids:
1570
# mRNA Isoforms:
1
mRNA Isoforms:
170,677 Da (1570 AA; Q9Y2H9)
4D Structure:
Part of a low affinity complex that associates with, but is distinct from, the post-synaptic density. Interacts with SNTB2
1D Structure:
Subfamily Alignment
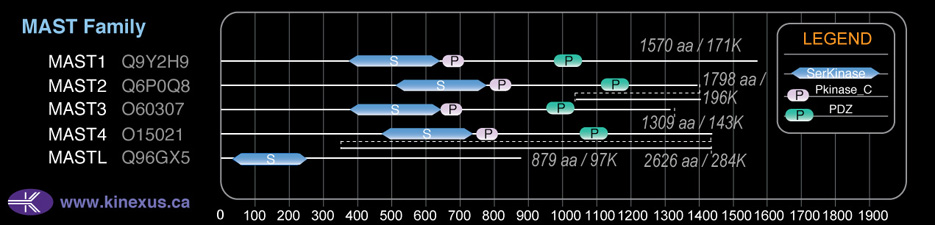
Domain Distribution:
Post-translation Modifications
For detailed information on phosphorylation of this kinase go to PhosphoNET
Serine phosphorylated:
S59, S64, S69, S139, S142, S152, S159, S161, S163, S283, S717, S736, S832, S919, S1102, S1113, S1252, S1258, S1351, S1356, S1357, S1426.
Threonine phosphorylated:
T45, T103, T140, T144, T728, T1431.
Tyrosine phosphorylated:
Y182, Y204, Y323, Y487, Y491, Y715.
Distribution
Based on gene microarray analysis from the NCBI
Human Tissue Distribution
% Max Expression:
Mean Expression:
Number of Samples:
Standard Deviation:
% Max Expression:
Mean Expression:
Number of Samples:
Standard Deviation:
 11
11
263
16
487
 0.5
0.5
11
8
10
 0.3
0.3
8
1
0
 13
13
315
51
508
 11
11
273
10
180
 5
5
131
53
277
 22
22
529
20
693
 50
50
1227
20
1997
 10
10
241
7
163
 6
6
156
51
255
 0.7
0.7
18
11
18
 16
16
379
113
509
 0.5
0.5
12
12
12
 0.6
0.6
14
5
13
 0.3
0.3
8
9
7
 0.8
0.8
19
9
22
 8
8
189
182
2201
 1.5
1.5
36
3
50
 0.6
0.6
14
46
14
 9
9
225
53
275
 3
3
66
10
38
 0.6
0.6
15
11
15
 5
5
130
10
59
 1.4
1.4
33
6
23
 0.8
0.8
19
10
17
 100
100
2441
25
4360
 0.7
0.7
18
12
19
 0.5
0.5
12
4
9
 0.2
0.2
4
4
3
 0.9
0.9
21
14
5
 12
12
284
18
207
 24
24
598
21
667
 14
14
352
55
540
 19
19
452
31
455
 0.7
0.7
17
22
11
Evolution
Species Conservation
PhosphoNET % Identity:
PhosphoNET % Similarity:
Homologene %
Identity:
PhosphoNET % Identity:
PhosphoNET % Similarity:
Homologene %
Identity:
 100
100
100
100 49.6
49.6
56.9
99 86.5
86.5
86.8
99 -
-
-
95 -
-
-
91 60.3
60.3
70.4
95 -
-
-
- 94.3
94.3
96.1
94.5 94
94
96
94 -
-
-
- 84.5
84.5
88.3
- 55.9
55.9
65.1
88 53.9
53.9
65.9
74 65.6
65.6
74
80 -
-
-
- -
-
-
- -
-
-
- -
-
-
- -
-
-
- -
-
-
- -
-
-
- -
-
-
- -
-
-
- -
-
-
- -
-
-
-
For a wider analysis go to PhosphoNET Evolution in PhosphoNET
Binding Proteins
Examples of known interacting proteins
hiddentext
| No. | Name – UniProt ID |
|---|---|
| 1 | SNTB2 - Q13425 |
| 2 | PTEN - P60484 |
| 3 | SNTA1 - Q13424 |
Regulation
Activation:
NA
Inhibition:
NA
Synthesis:
NA
Degradation:
NA
Protein Kinase Specificity
Matrix of observed frequency (%) of amino acids in aligned protein substrate phosphosites
Matrix Type:
Predicted from the application of the Kinexus Kinase Substrate Predictor Version 2.0 algorithm, which was trained with over 10,000 kinase-protein substrate pairs and 8,000 kinase-peptide substrate pairs.
Domain #:
1
Inhibitors
For further details on these inhibitors click on the Compound Name and enter it into DrugKiNET or click on the ID's
Based on in vitro and/or in vivo phosphorylation data
| Compound Name | KD, Ki or IC50 (nM) | PubChem ID | ChEMBL ID | PubMed ID |
|---|
| Lestaurtinib | Kd = 19 nM | 126565 | 22037378 | |
| Dovitinib | Kd = 40 nM | 57336746 | 22037378 | |
| Staurosporine | Kd = 150 nM | 5279 | 22037378 | |
| N-Benzoylstaurosporine | Kd = 190 nM | 56603681 | 608533 | 22037378 |
| Sunitinib | Kd = 200 nM | 5329102 | 535 | 19654408 |
| SU14813 | Kd = 300 nM | 10138259 | 1721885 | 22037378 |
| Bosutinib | Kd = 350 nM | 5328940 | 288441 | 22037378 |
| Ruxolitinib | Kd = 520 nM | 25126798 | 1789941 | 22037378 |
| WZ3146 | Kd > 1 µM | 44607360 | 20033049 | |
| WZ4002 | Kd > 1 µM | 44607530 | 20033049 | |
| NVP-TAE684 | Kd = 3.3 µM | 16038120 | 509032 | 22037378 |
| Nintedanib | Kd = 4.6 µM | 9809715 | 502835 | 22037378 |
Disease Linkage
General Disease Association:
Cancer
Specific Cancer Types:
Breast cancer
Comments:
MAST1 has been shown in a fusion model with Notch to induced proliferation and has been observed in breast cancers. However, the role of MAST needs to be further characterized before concluding that it is a possible inducer of cancer.
Gene Expression in Cancers:
The COSMIC website notes an up-regulated expression score for MAST1 in diverse human cancers of 412, which is 0.9-fold of the average score of 462 for the human protein kinases. The down-regulated expression score of 0 for this protein kinase in human cancers was 100% lower than the average score of 60 for the human protein kinases.
Mutagenesis Experiments:
Insertional mutagenesis studies in mice have not yet revealed a role for this protein kinase in mouse cancer oncogenesis.
Mutation Rate in All Cancers:
Percent mutation rates per 100 amino acids length in human cancers: 0.07 % in 24915 diverse cancer specimens. This rate is only -10 % lower and is very similar to the average rate of 0.075 % calculated for human protein kinases in general.
Mutation Rate in Specific Cancers:
Highest percent mutation rates per 100 amino acids length in human cancers: 0.32 % in 864 skin cancers tested; 0.27 % in 1270 large intestine cancers tested; 0.24 % in 589 stomach cancers tested; 0.19 % in 603 endometrium cancers tested; 0.19 % in 548 urinary tract cancers tested; 0.19 % in 273 cervix cancers tested; 0.08 % in 1823 lung cancers tested; 0.07 % in 833 ovary cancers tested; 0.07 % in 710 oesophagus cancers tested; 0.07 % in 1316 breast cancers tested; 0.05 % in 942 upper aerodigestive tract cancers tested; 0.05 % in 881 prostate cancers tested; 0.05 % in 558 thyroid cancers tested; 0.04 % in 1512 liver cancers tested; 0.03 % in 238 bone cancers tested; 0.02 % in 382 soft tissue cancers tested; 0.02 % in 2082 central nervous system cancers tested; 0.02 % in 2009 haematopoietic and lymphoid cancers tested; 0.02 % in 1459 pancreas cancers tested; 0.01 % in 1276 kidney cancers tested.
Frequency of Mutated Sites:
Most frequent mutations with the number of reports indicated in brackets: L792W (6); V108I (5).
Comments:
Only 5 deletions, and no insertions or complex mutations are noted on the COSMIC website.