
Nomenclature
Short Name:
MAST2
Full Name:
Microtubule-associated serine-threonine-protein kinase 2
Alias:
- EC 2.7.11.1
- KIAA0807
- MAST205
- Microtubule associated serine/threonine kinase 2
Classification
Type:
Protein-serine/threonine kinase
Group:
AGC
Family:
MAST
SubFamily:
NA

Structure
Mol. Mass (Da):
196,436
# Amino Acids:
1798
# mRNA Isoforms:
2
mRNA Isoforms:
196,436 Da (1798 AA; Q6P0Q8); 176,132 Da (1608 AA; Q6P0Q8-2)
4D Structure:
Interacts with CDHR2.
1D Structure:
Subfamily Alignment
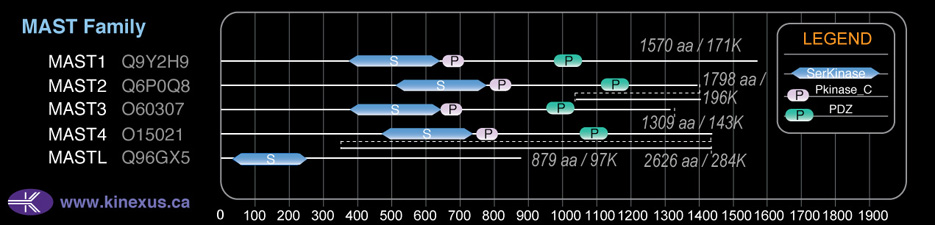
Domain Distribution:
Post-translation Modifications
For detailed information on phosphorylation of this kinase go to PhosphoNET
Acetylated:
K1203, K1207, K1209.
Methylated:
R1004.
Serine phosphorylated:
S66, S74, S81, S92, S144, S148, S151, S160, S183, S191, S204, S209, S230, S278, S281, S290, S297, S299, S301, S305, S806, S825, S846, S854, S855, S860, S874, S876, S883, S895, S900, S914, S918, S920, S931, S993, S995, S996, S1007, S1032, S1050, S1085, S1180, S1195, S1240, S1247, S1250, S1256, S1257, S1275, S1337, S1340, S1351, S1364, S1381, S1393, S1399, S1407, S1425, S1429, S1435, S1447, S1503, S1504, S1631, S1642, S1660, S1669, S1698, S1768, S1771.
Threonine phosphorylated:
T82, T185, T243, T274, T279, T867, T871, T1349, T1508, T1564, T1567, T1798.
Tyrosine phosphorylated:
Y461, Y812, Y853.
Ubiquitinated:
K1183, K1197.
Distribution
Based on gene microarray analysis from the NCBI
Human Tissue Distribution
% Max Expression:
Mean Expression:
Number of Samples:
Standard Deviation:
% Max Expression:
Mean Expression:
Number of Samples:
Standard Deviation:
 99
99
810
55
1014
 20
20
166
28
274
 24
24
196
23
156
 44
44
356
174
523
 100
100
814
48
648
 5
5
41
148
38
 26
26
214
58
383
 95
95
775
72
872
 74
74
603
34
469
 11
11
90
150
89
 13
13
105
57
165
 85
85
694
291
613
 6
6
49
69
139
 40
40
327
20
737
 12
12
98
45
208
 13
13
110
30
172
 11
11
88
150
111
 24
24
197
41
339
 51
51
412
184
624
 56
56
458
220
635
 22
22
176
41
289
 6
6
45
47
34
 9
9
72
27
54
 80
80
654
43
906
 14
14
117
41
167
 100
100
815
105
2076
 12
12
101
75
193
 24
24
192
40
440
 22
22
180
41
232
 25
25
206
56
128
 40
40
323
36
435
 73
73
595
68
543
 11
11
90
99
264
 98
98
801
104
658
 49
49
399
61
542
Evolution
Species Conservation
PhosphoNET % Identity:
PhosphoNET % Similarity:
Homologene %
Identity:
PhosphoNET % Identity:
PhosphoNET % Similarity:
Homologene %
Identity:
 100
100
100
100 68.5
68.5
68.7
100 97
97
97.7
97 -
-
-
90 -
-
-
90 82.9
82.9
86.3
89.5 -
-
-
- 85.4
85.4
88.7
88 56.8
56.8
65.8
89 -
-
-
- 57.6
57.6
65.9
- 68.7
68.7
76.2
82 51
51
62
81 64.9
64.9
75
79 -
-
-
- -
-
-
37 -
-
-
- -
-
-
- -
-
-
- -
-
-
- -
-
-
- -
-
-
- -
-
-
- -
-
-
- -
-
-
-
For a wider analysis go to PhosphoNET Evolution in PhosphoNET
Binding Proteins
Examples of known interacting proteins
hiddentext
| No. | Name – UniProt ID |
|---|---|
| 1 | RPS27A - P62988 |
| 2 | RPS27A - P62979 |
| 3 | CDHR2 - Q9BYE9 |
| 4 | SLC34A1 - Q06495 |
| 5 | DYNLL1 - P63167 |
| 6 | STK36 - Q9NRP7 |
| 7 | GCN1L1 - Q92616 |
| 8 | YWHAH - Q04917 |
Regulation
Activation:
NA
Inhibition:
NA
Synthesis:
NA
Degradation:
NA
Protein Kinase Specificity
Matrix of observed frequency (%) of amino acids in aligned protein substrate phosphosites
Matrix Type:
Predicted from the application of the Kinexus Kinase Substrate Predictor Version 2.0 algorithm, which was trained with over 10,000 kinase-protein substrate pairs and 8,000 kinase-peptide substrate pairs.
Domain #:
1
Disease Linkage
General Disease Association:
Cancer
Specific Cancer Types:
Breast cancer
Comments:
A translocation of the MAST2 may be involved in breast carcinoma and pre-invasive lesions.
Gene Expression in Cancers:
TranscriptoNET (www.transcriptonet.ca) analysis with mRNA expression data retrieved from the National Center for Biotechnology Information's Gene Expression Omnibus (GEO) database, which was normalized against 60 abundantly and commonly found proteins, indicated altered expression for this protein kinase as shown here as the percent change from normal tissue controls (%CFC) as supported with the Student T-test in the following types of human cancers: Barrett's esophagus epithelial metaplasia (%CFC= +74, p<0.021); Breast epithelial cell carcinomas (%CFC= +51, p<0.033); Lung adenocarcinomas (%CFC= +117, p<0.002); and Ovary adenocarcinomas (%CFC= +118, p<0.005).
Mutagenesis Experiments:
Insertional mutagenesis studies in mice have not yet revealed a role for this protein kinase in mouse cancer oncogenesis.
Mutation Rate in All Cancers:
Percent mutation rates per 100 amino acids length in human cancers: 0.05 % in 24494 diverse cancer specimens. This rate is only -30 % lower than the average rate of 0.075 % calculated for human protein kinases in general.
Mutation Rate in Specific Cancers:
Highest percent mutation rates per 100 amino acids length in human cancers: 0.34 % in 1052 large intestine cancers tested; 0.18 % in 805 skin cancers tested; 0.14 % in 569 stomach cancers tested; 0.11 % in 602 endometrium cancers tested; 0.1 % in 820 ovary cancers tested; 0.08 % in 1594 lung cancers tested; 0.05 % in 1270 liver cancers tested.
Frequency of Mutated Sites:
None > 2 in 20,253 cancer specimens
Comments:
Eight deletions (7 at F726fs*12 ) and 4 (2 at G727fs*14) insertions, and no complex mutations are noted on the COSMIC website.