
Nomenclature
Short Name:
MASTL
Full Name:
Microtubule associated serine-threonine kinase-like
Alias:
- EC 2.7.11.1
- THC2
Classification
Type:
Protein-serine/threonine kinase
Group:
AGC
Family:
MAST
SubFamily:
NA

Structure
Mol. Mass (Da):
97,319
# Amino Acids:
879
# mRNA Isoforms:
3
mRNA Isoforms:
97,319 Da (879 AA; Q96GX5); 97,191 Da (878 AA; Q96GX5-3); 92,861 Da (840 AA; Q96GX5-2)
4D Structure:
NA
1D Structure:
3D Image (rendered using PV Viewer):
PDB ID
Subfamily Alignment
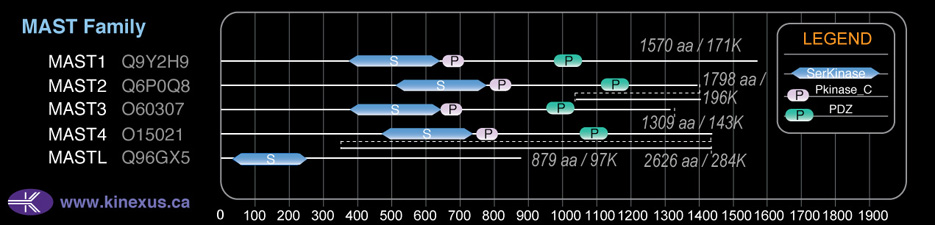
Domain Distribution:
Post-translation Modifications
For detailed information on phosphorylation of this kinase go to PhosphoNET
Acetylated:
K644.
Serine phosphorylated:
S31, S213+, S216+, S217+, S264, S265, S270, S277, S288, S293, S303, S311, S319, S320, S330, S370, S375, S376, S384, S442, S452, S453, S512, S550, S551, S552, S556, S631, S657+, S660, S665+, S668, S671, S725+, S875, S878.
Threonine phosphorylated:
T194+, T207+, T222+, T261, T274, T380, T514, T519, T611, T618, T710, T718, T722+, T741-.
Tyrosine phosphorylated:
Y59, Y720+.
Ubiquitinated:
K39, K66, K158, K179, K199, K644.
Distribution
Based on gene microarray analysis from the NCBI
Human Tissue Distribution
% Max Expression:
Mean Expression:
Number of Samples:
Standard Deviation:
% Max Expression:
Mean Expression:
Number of Samples:
Standard Deviation:
 23
23
1963
9
1737
 0.3
0.3
22
1
0
 0.5
0.5
45
9
42
 9
9
732
40
2098
 9
9
771
10
499
 0.4
0.4
34
9
13
 0.3
0.3
25
10
5
 31
31
2675
17
4984
 -
-
-
-
-
 0.5
0.5
47
26
21
 0.4
0.4
32
13
45
 4
4
385
19
489
 0.9
0.9
79
11
59
 -
-
-
-
-
 0.6
0.6
50
13
47
 0.4
0.4
37
5
24
 0.8
0.8
68
16
87
 0.6
0.6
50
11
50
 0.3
0.3
29
29
24
 12
12
1021
28
575
 0.7
0.7
56
13
47
 0.8
0.8
69
13
58
 0.9
0.9
78
11
56
 1.1
1.1
97
11
74
 1.1
1.1
93
13
91
 11
11
938
30
1635
 1.1
1.1
97
11
71
 0.9
0.9
78
11
56
 0.9
0.9
75
11
51
 0.4
0.4
32
14
24
 13
13
1106
12
89
 100
100
8585
11
9652
 0.1
0.1
7
12
3
 10
10
870
26
724
 2
2
145
22
186
Evolution
Species Conservation
PhosphoNET % Identity:
PhosphoNET % Similarity:
Homologene %
Identity:
PhosphoNET % Identity:
PhosphoNET % Similarity:
Homologene %
Identity:
 100
100
100
100 91.2
91.2
91.5
99 96.5
96.5
98.1
97 -
-
-
84 -
-
-
- 83
83
89.3
83 -
-
-
- 74.4
74.4
84.6
76 -
-
-
76 -
-
-
- 65
65
75.4
- 60.2
60.2
73
62 -
-
-
57 50
50
65.1
54 -
-
-
- -
-
-
34 24.5
24.5
40.9
- -
-
-
- -
-
-
- -
-
-
- -
-
-
- -
-
-
- -
-
-
- -
-
-
- -
-
-
-
For a wider analysis go to PhosphoNET Evolution in PhosphoNET
Regulation
Activation:
NA
Inhibition:
NA
Synthesis:
NA
Degradation:
NA
Known Upstream Kinases
For further details on these substrates click on the Substrate Short Name or UniProt ID. Phosphosite Location is hyperlinked to PhosphoNET
predictions.
Based on in vitro and/or in vivo phosphorylation data
| Kinase Short Name | UniProt ID (Human) | Phosphosite Location | Phosphosite Sequence | Effect of Phosphorylation |
|---|
Known Downstream Substrates
For further details on these substrates click on the Substrate Short Name or UniProt ID. Phosphosite Location is hyperlinked to PhosphoNET
predictions.
Based on in vitro and/or in vivo phosphorylation data
| Substrate Short Name | UniProt ID (Human) | Phosphosite Location | Phosphosite Sequence | Effect of Phosphorylation |
|---|
Protein Kinase Specificity
Matrix of observed frequency (%) of amino acids in aligned protein substrate phosphosites
Matrix Type:
Predicted from the application of the Kinexus Kinase Substrate Predictor Version 2.0 algorithm, which was trained with over 10,000 kinase-protein substrate pairs and 8,000 kinase-peptide substrate pairs.
Domain #:
1
Disease Linkage
General Disease Association:
Immune disorders
Specific Diseases (Non-cancerous):
Mastl-related thrombocytopenia 2; Thrombocytopenia; Thrombocytopenia 2; Gray platelet syndrome
Comments:
E167D mutation in autosomal dominant thrombocytopenia 2, which is characterized by a decreased in numbers of platelets in circulating blood, resulting in risks of increased bleeding and decreased ability for clotting.
Gene Expression in Cancers:
TranscriptoNET (www.transcriptonet.ca) analysis with mRNA expression data retrieved from the National Center for Biotechnology Information's Gene Expression Omnibus (GEO) database, which was normalized against 60 abundantly and commonly found proteins, indicated altered expression for this protein kinase as shown here as the percent change from normal tissue controls (%CFC) as supported with the Student T-test in the following types of human cancers: Large B-cell lymphomas (%CFC= +50, p<0.003); Ovary adenocarcinomas (%CFC= +121, p<0.009); and Vulvar intraepithelial neoplasia (%CFC= +109, p<0.0005). The COSMIC website notes an up-regulated expression score for MASTL in diverse human cancers of 591, which is 1.3-fold of the average score of 462 for the human protein kinases. The down-regulated expression score of 55 for this protein kinase in human cancers was 0.9-fold of the average score of 60 for the human protein kinases.
Mutagenesis Experiments:
Insertional mutagenesis studies in mice have not yet revealed a role for this protein kinase in mouse cancer oncogenesis.
Mutation Rate in All Cancers:
Percent mutation rates per 100 amino acids length in human cancers: 0.07 % in 24914 diverse cancer specimens. This rate is only -8 % lower and is very similar to the average rate of 0.075 % calculated for human protein kinases in general.
Mutation Rate in Specific Cancers:
Highest percent mutation rates per 100 amino acids length in human cancers: 0.35 % in 1270 large intestine cancers tested; 0.28 % in 603 endometrium cancers tested; 0.25 % in 864 skin cancers tested; 0.21 % in 589 stomach cancers tested; 0.21 % in 273 cervix cancers tested; 0.1 % in 238 bone cancers tested; 0.08 % in 548 urinary tract cancers tested; 0.07 % in 942 upper aerodigestive tract cancers tested; 0.06 % in 1822 lung cancers tested; 0.06 % in 1316 breast cancers tested; 0.05 % in 833 ovary cancers tested; 0.05 % in 1512 liver cancers tested; 0.05 % in 1459 pancreas cancers tested; 0.04 % in 558 thyroid cancers tested; 0.04 % in 2009 haematopoietic and lymphoid cancers tested; 0.03 % in 441 autonomic ganglia cancers tested; 0.02 % in 710 oesophagus cancers tested; 0.02 % in 1276 kidney cancers tested; 0.01 % in 881 prostate cancers tested; 0.01 % in 2082 central nervous system cancers tested.
Frequency of Mutated Sites:
None > 7 in 20,197 cancer specimens
Comments:
Twelve deletions, 7 insertions and no complex mutations are noted on the COSMIC website.