
Nomenclature
Short Name:
MNK1
Full Name:
MAP kinase-interacting serine-threonine kinase 1
Alias:
- EC 2.7.11.1
- MKNK1
Classification
Type:
Protein-serine/threonine kinase
Group:
CAMK
Family:
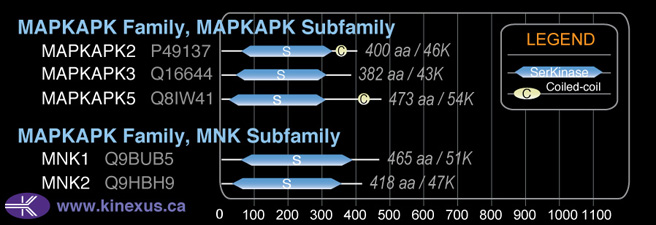
MAPKAPK
SubFamily:
MNK

Specific Links
Structure
Mol. Mass (Da):
51,342
# Amino Acids:
465
# mRNA Isoforms:
3
mRNA Isoforms:
51,342 Da (465 AA; Q9BUB5); 47,402 Da (424 AA; Q9BUB5-2); 39,104 Da (347 AA; Q9BUB5-3)
4D Structure:
Interacts with the C-terminal regions of EIF4G1 and EIF4G2. Also binds to dephosphorylated ERK1 and ERK2, and to the p38 kinases
1D Structure:
3D Image (rendered using PV Viewer):
PDB ID
Subfamily Alignment
Domain Distribution:
| Start | End | Domain |
|---|---|---|
| 49 | 374 | Pkinase |
Kinexus Products
Click on entries below for direct links to relevant products from Kinexus for this protein kinase.
hiddentext
Post-translation Modifications
For detailed information on phosphorylation of this kinase go to PhosphoNET
Methylated:
R455.
Serine phosphorylated:
S39, S148, S221, S226, S237+, S244+, S393, S413, S460.
Threonine phosphorylated:
T250+, T255+, T385+.
Tyrosine phosphorylated:
Y60.
Distribution
Based on gene microarray analysis from the NCBI
Human Tissue Distribution
% Max Expression:
Mean Expression:
Number of Samples:
Standard Deviation:
% Max Expression:
Mean Expression:
Number of Samples:
Standard Deviation:
 100
100
1543
28
999
 10
10
161
12
94
 15
15
230
13
135
 18
18
279
108
396
 55
55
848
31
591
 15
15
232
61
438
 14
14
217
39
406
 26
26
408
37
579
 42
42
643
10
416
 10
10
162
85
72
 13
13
193
30
119
 50
50
777
122
715
 19
19
288
24
173
 10
10
151
9
56
 31
31
475
15
461
 6
6
90
18
85
 5
5
70
200
75
 8
8
131
19
73
 13
13
204
73
116
 51
51
793
107
559
 13
13
194
26
149
 17
17
258
28
192
 18
18
284
22
176
 10
10
154
20
102
 22
22
338
26
290
 41
41
637
72
634
 16
16
250
27
316
 15
15
233
20
283
 15
15
237
20
155
 21
21
331
28
172
 61
61
934
30
637
 34
34
519
31
589
 6
6
98
81
134
 76
76
1172
83
875
 15
15
238
48
216
Evolution
Species Conservation
PhosphoNET % Identity:
PhosphoNET % Similarity:
Homologene %
Identity:
PhosphoNET % Identity:
PhosphoNET % Similarity:
Homologene %
Identity:
 100
100
100
100 96.8
96.8
96.8
99 88
88
88.2
99 -
-
-
94 -
-
-
73 82.8
82.8
85.8
94 -
-
-
- 85.4
85.4
88.6
94 82.4
82.4
85.4
94.5 -
-
-
- -
-
-
- 51.6
51.6
63.4
86 72
72
79.8
83 68.4
68.4
76.8
78 -
-
-
- 20.3
20.3
28.2
59.5 46.1
46.1
63.2
- -
-
-
40 37.8
37.8
52.5
- -
-
-
- -
-
-
- -
-
-
- -
-
-
- -
-
-
- -
-
-
-
For a wider analysis go to PhosphoNET Evolution in PhosphoNET
Binding Proteins
Examples of known interacting proteins
hiddentext
| No. | Name – UniProt ID |
|---|---|
| 1 | EIF4E - P06730 |
| 2 | EIF4G3 - O43432 |
| 3 | MAPK14 - Q16539 |
| 4 | PAK2 - Q13177 |
| 5 | PSMD2 - Q13200 |
| 6 | MAPK1 - P28482 |
| 7 | MAPK3 - P27361 |
Regulation
Activation:
Phosphorylated and activated by the p38 kinases and kinases in the Erk pathway
Inhibition:
NA
Synthesis:
NA
Degradation:
NA
Known Upstream Kinases
For further details on these substrates click on the Substrate Short Name or UniProt ID. Phosphosite Location is hyperlinked to PhosphoNET
predictions.
Based on in vitro and/or in vivo phosphorylation data
| Kinase Short Name | UniProt ID (Human) | Phosphosite Location | Phosphosite Sequence | Effect of Phosphorylation |
|---|
| PAK2 | Q13177 | S39 | RRGRATDSLPGKFED | ? |
| ERK2 | P28482 | S226 | CESPEKVSPVKICDF | |
| p38a | Q16539 | T250 | NSCTPITTPELTTPC | + |
| ERK1 | P27361 | T250 | NSCTPITTPELTTPC | + |
| ERK2 | P28482 | T250 | NSCTPITTPELTTPC | + |
| p38a | Q16539 | T255 | ITTPELTTPCGSAEY | + |
| ERK1 | P27361 | T255 | ITTPELTTPCGSAEY | + |
| ERK2 | P28482 | T255 | ITTPELTTPCGSAEY | + |
| ERK1 | P27361 | T385 | APEKGLPTPQVLQRN | + |
| ERK2 | P28482 | T385 | APEKGLPTPQVLQRN | + |
Known Downstream Substrates
For further details on these substrates click on the Substrate Short Name or UniProt ID. Phosphosite Location is hyperlinked to PhosphoNET
predictions.
Based on in vitro and/or in vivo phosphorylation data
| Substrate Short Name | UniProt ID (Human) | Phosphosite Location | Phosphosite Sequence | Effect of Phosphorylation |
|---|
| cPLA2 | P47712 | S727 | RQNPSRCSVSLSNVE | + |
| eIF4E | P06730 | S209 | DTATKSGSTTKNRFV | + |
| eIF4E | P06730 | T210 | TATKSGSTTKNRFVV | |
| hnRNP A1 | P09651 | S192 | EMASASSSQRGRSGS | |
| hnRNP A1 | P09651 | S362 | GGYGGSSSSSSYGSG | |
| hnRNP A1 | P09651 | S363 | GYGGSSSSSSYGSGR | |
| hnRNP A1 | P09651 | S364 | YGGSSSSSSYGSGRR | |
| SFPQ (PSF) | P23246 | S283 | EGFKANLSLLRRPGE | |
| SFPQ (PSF) | P23246 | S8 | MSRDRFRSRGGGGGG | |
| Spry2 | O43597 | S112 | APLSRSISTVSSGSR | |
| Spry2 | O43597 | S121 | VSSGSRSSTRTSTSS |
Protein Kinase Specificity
Matrix of observed frequency (%) of amino acids in aligned protein substrate phosphosites
Matrix Type:
Predicted from the application of the Kinexus Kinase Substrate Predictor Version 2.0 algorithm, which was trained with over 10,000 kinase-protein substrate pairs and 8,000 kinase-peptide substrate pairs.
Domain #:
1
Inhibitors
For further details on these inhibitors click on the Compound Name and enter it into DrugKiNET or click on the ID's
Based on in vitro and/or in vivo phosphorylation data
| Compound Name | KD, Ki or IC50 (nM) | PubChem ID | ChEMBL ID | PubMed ID |
|---|
Disease Linkage
Gene Expression in Cancers:
TranscriptoNET (www.transcriptonet.ca) analysis with mRNA expression data retrieved from the National Center for Biotechnology Information's Gene Expression Omnibus (GEO) database, which was normalized against 60 abundantly and commonly found proteins, indicated altered expression for this protein kinase as shown here as the percent change from normal tissue controls (%CFC) as supported with the Student T-test in the following types of human cancers: Cervical cancer stage 2A (%CFC= -60, p<0.033); Cervical cancer stage 2B (%CFC= -58, p<0.076); Clear cell renal cell carcinomas (cRCC) stage I (%CFC= -48, p<0.007); and Prostate cancer - primary (%CFC= -84, p<0.0001).
Mutagenesis Experiments:
Insertional mutagenesis studies in mice have not yet revealed a role for this protein kinase in mouse cancer oncogenesis.
Frequency of Mutated Sites:
None > 3 in 20,841 cancer specimens