
Nomenclature
Short Name:
MNK2
Full Name:
MAP kinase-interacting serine-threonine kinase 2
Alias:
- EC 2.7.11.1
- GPRK7
- GPRK8
- MKNK2
Classification
Type:
Protein-serine/threonine kinase
Group:
CAMK
Family:
MAPKAPK
SubFamily:
MNK

Specific Links
Structure
Mol. Mass (Da):
46711
# Amino Acids:
414
# mRNA Isoforms:
2
mRNA Isoforms:
51,875 Da (465 AA; Q9HBH9); 46,711 Da (414 AA; Q9HBH9-2)
4D Structure:
Monomer. Interacts with the C-terminal regions of EIF4G1 and EIF4G2. Also binds to dephosphorylated ERK1 and ERK2. Isoform 2 interacts with ESR2.
1D Structure:
3D Image (rendered using PV Viewer):
PDB ID
Subfamily Alignment
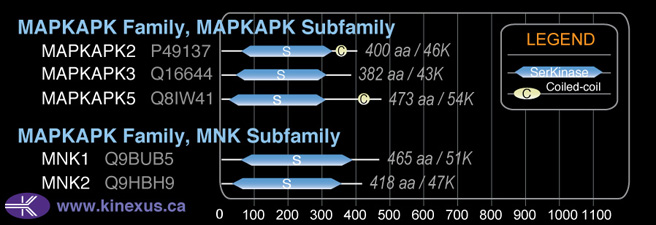
Domain Distribution:
| Start | End | Domain |
|---|---|---|
| 84 | 368 | Pkinase |
Post-translation Modifications
For detailed information on phosphorylation of this kinase go to PhosphoNET
Serine phosphorylated:
S15, S74, S76+, S437, S440, S442, S452.
Threonine phosphorylated:
T72+, T244+, T249+, T379+.
Ubiquitinated:
K326.
Distribution
Based on gene microarray analysis from the NCBI
Human Tissue Distribution
% Max Expression:
Mean Expression:
Number of Samples:
Standard Deviation:
% Max Expression:
Mean Expression:
Number of Samples:
Standard Deviation:
 52
52
1247
22
802
 42
42
1009
15
726
 16
16
380
13
437
 28
28
675
88
1248
 60
60
1446
27
713
 38
38
903
46
641
 49
49
1185
36
782
 36
36
874
39
1020
 49
49
1178
13
685
 17
17
418
97
288
 18
18
426
33
382
 35
35
845
140
863
 18
18
443
24
284
 23
23
553
12
456
 30
30
712
32
595
 27
27
638
14
471
 11
11
261
264
372
 35
35
844
23
729
 100
100
2397
82
1540
 63
63
1504
87
696
 10
10
239
29
267
 32
32
757
32
785
 18
18
424
14
363
 24
24
580
23
611
 21
21
494
30
517
 61
61
1473
59
1313
 35
35
847
30
572
 31
31
741
23
702
 18
18
429
24
416
 48
48
1153
28
789
 54
54
1288
18
367
 49
49
1164
26
1012
 32
32
776
109
1308
 52
52
1238
52
697
 14
14
339
44
406
Evolution
Species Conservation
PhosphoNET % Identity:
PhosphoNET % Similarity:
Homologene %
Identity:
PhosphoNET % Identity:
PhosphoNET % Similarity:
Homologene %
Identity:
 100
100
100
100 42.9
42.9
48.6
96 92.4
92.4
93.5
99 -
-
-
95 -
-
-
96 34.7
34.7
36.9
92 -
-
-
- 92.7
92.7
95.3
95 92.7
92.7
95.3
94 -
-
-
- -
-
-
- 60.8
60.8
73
84 76.9
76.9
87.8
78.5 73.3
73.3
84.5
79 -
-
-
- 24
24
31
- 49.8
49.8
66.7
- -
-
-
50 48.7
48.7
64.6
- -
-
-
- -
-
-
- -
-
-
- -
-
-
- -
-
-
- -
-
-
-
For a wider analysis go to PhosphoNET Evolution in PhosphoNET
Binding Proteins
Examples of known interacting proteins
hiddentext
| No. | Name – UniProt ID |
|---|---|
| 1 | MAPK1 - P28482 |
| 2 | EIF4E - P06730 |
| 3 | EIF4G1 - Q04637 |
| 4 | ESR2 - Q92731 |
| 5 | ESR1 - P03372 |
| 6 | MAPK14 - Q16539 |
| 7 | EIF4G2 - P78344 |
Regulation
Activation:
NA
Inhibition:
NA
Synthesis:
NA
Degradation:
NA
Known Upstream Kinases
For further details on these substrates click on the Substrate Short Name or UniProt ID. Phosphosite Location is hyperlinked to PhosphoNET
predictions.
Based on in vitro and/or in vivo phosphorylation data
| Kinase Short Name | UniProt ID (Human) | Phosphosite Location | Phosphosite Sequence | Effect of Phosphorylation |
|---|
| ERK2 | P28482 | T244 | GDCSPISTPELLTPC | + |
| p38a | Q16539 | T244 | GDCSPISTPELLTPC | + |
| ERK1 | P27361 | T244 | GDCSPISTPELLTPC | + |
| ERK2 | P28482 | T249 | ISTPELLTPCGSAEY | + |
| p38a | Q16539 | T249 | ISTPELLTPCGSAEY | + |
| ERK1 | P27361 | T249 | ISTPELLTPCGSAEY | + |
| ERK2 | P28482 | T379 | APENTLPTPMVLQRN | + |
| p38a | Q16539 | T379 | APENTLPTPMVLQRN | + |
| ERK1 | P27361 | T379 | APENTLPTPMVLQRN | + |
Known Downstream Substrates
For further details on these substrates click on the Substrate Short Name or UniProt ID. Phosphosite Location is hyperlinked to PhosphoNET
predictions.
Based on in vitro and/or in vivo phosphorylation data
| Substrate Short Name | UniProt ID (Human) | Phosphosite Location | Phosphosite Sequence | Effect of Phosphorylation |
|---|
Protein Kinase Specificity
Matrix of observed frequency (%) of amino acids in aligned protein substrate phosphosites
Matrix Type:
Predicted from the application of the Kinexus Kinase Substrate Predictor Version 2.0 algorithm, which was trained with over 10,000 kinase-protein substrate pairs and 8,000 kinase-peptide substrate pairs.
Domain #:
1
Inhibitors
For further details on these inhibitors click on the Compound Name and enter it into DrugKiNET or click on the ID's
Based on in vitro and/or in vivo phosphorylation data
| Compound Name | KD, Ki or IC50 (nM) | PubChem ID | ChEMBL ID | PubMed ID |
|---|
Disease Linkage
Gene Expression in Cancers:
TranscriptoNET (www.transcriptonet.ca) analysis with mRNA expression data retrieved from the National Center for Biotechnology Information's Gene Expression Omnibus (GEO) database, which was normalized against 60 abundantly and commonly found proteins, indicated altered expression for this protein kinase as shown here as the percent change from normal tissue controls (%CFC) as supported with the Student T-test in the following types of human cancers: Barrett's esophagus epithelial metaplasia (%CFC= -57, p<(0.0003); Bladder carcinomas (%CFC= +102, p<0.005); Brain glioblastomas (%CFC= -48, p<0.0002); Breast epithelial cell carcinomas (%CFC= +45, p<0.014); Large B-cell lymphomas (%CFC= +128, p<0.038); Oral squamous cell carcinomas (OSCC) (%CFC= -51, p<0.045); Prostate cancer - primary (%CFC= +174, p<0.0001); and Skin fibrosarcomas (%CFC= -70). The COSMIC website notes an up-regulated expression score for MNK2 in diverse human cancers of 364, which is 0.8-fold of the average score of 462 for the human protein kinases. The down-regulated expression score of 37 for this protein kinase in human cancers was 0.6-fold of the average score of 60 for the human protein kinases.
Mutagenesis Experiments:
Insertional mutagenesis studies in mice support a role for this protein kinase in mouse cancer oncogenesis. Phosphorylation of MNK2 can be reduced with a D228G mutation. Kinase phosphotransferase activity can be inhibited with the T244A + T249A mutations. A T379D mutation can induce constitutive MNK2 activation.
Mutation Rate in All Cancers:
Percent mutation rates per 100 amino acids length in human cancers: 0.06 % in 25371 diverse cancer specimens. This rate is only -26 % lower than the average rate of 0.075 % calculated for human protein kinases in general.
Mutation Rate in Specific Cancers:
Highest percent mutation rates per 100 amino acids length in human cancers: 0.29 % in 589 stomach cancers tested; 0.27 % in 1270 large intestine cancers tested; 0.17 % in 864 skin cancers tested; 0.09 % in 273 cervix cancers tested; 0.09 % in 1316 breast cancers tested; 0.08 % in 603 endometrium cancers tested; 0.08 % in 1512 liver cancers tested; 0.07 % in 1956 lung cancers tested; 0.06 % in 1276 kidney cancers tested; 0.05 % in 1467 pancreas cancers tested; 0.04 % in 548 urinary tract cancers tested; 0.03 % in 958 upper aerodigestive tract cancers tested; 0.03 % in 939 prostate cancers tested; 0.02 % in 2009 haematopoietic and lymphoid cancers tested; 0.01 % in 2082 central nervous system cancers tested.
Frequency of Mutated Sites:
None > 3 in 20,654 cancer specimens
Comments:
No deletions, insertions or complex mutations are noted on the COSMIC website.