
Nomenclature
Short Name:
MSK1
Full Name:
Ribosomal protein S6 kinase alpha 5
Alias:
- 90 kDa ribosomal protein S6 kinase, , polypeptide 5
- 90 kDa ribosomal protein S6 kinase, KS6A5
- Nuclear mitogen- and stress-activated protein kinase-1
- RPS6KA5
- Ribosomal protein S6 kinase
- Polypeptide V; MGC1911; RLPK
- EC 2.7.11.1
- Kinase MSK1
- KS6A5
- MSPK1
Classification
Type:
Protein-serine/threonine kinase
Group:
AGC
Family:
RSK
SubFamily:
MSK

Specific Links
Structure
Mol. Mass (Da):
89,865
# Amino Acids:
802
# mRNA Isoforms:
3
mRNA Isoforms:
89,865 Da (802 AA; O75582); 81,780 Da (723 AA; O75582-3); 61,769 Da (549 AA; O75582-2)
4D Structure:
Forms a complex with either ERK1 or ERK2 in quiescent cells which transiently dissociates following mitogenic stimulation. Also associates with MAPK14/p38-alpha. Activated RPS6KA5 associates with and phosphorylates the NF-kappa-B p65 subunit RELA
1D Structure:
3D Image (rendered using PV Viewer):
PDB ID
Subfamily Alignment
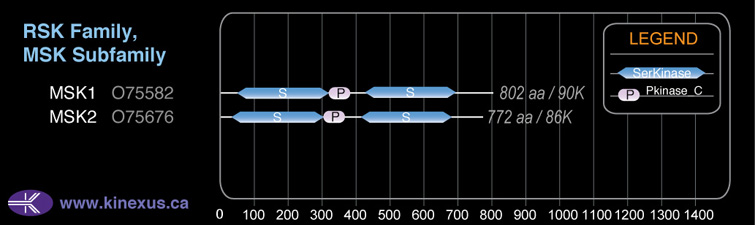
Domain Distribution:
Kinexus Products
Click on entries below for direct links to relevant products from Kinexus for this protein kinase.
hiddentext
Post-translation Modifications
For detailed information on phosphorylation of this kinase go to PhosphoNET
Serine phosphorylated:
S212+, S240, S253, S268, S360+, S376+, S381, S691, S694, S695, S750, S752, S757, S758, S759, S760, S766, S770, S798.
Threonine phosphorylated:
T38, T581+, T700+, T751, T793.
Tyrosine phosphorylated:
Y60, Y375, Y683.
Distribution
Based on gene microarray analysis from the NCBI
Human Tissue Distribution
% Max Expression:
Mean Expression:
Number of Samples:
Standard Deviation:
% Max Expression:
Mean Expression:
Number of Samples:
Standard Deviation:
 86
86
760
35
869
 4
4
33
16
33
 13
13
115
18
105
 41
41
365
124
478
 100
100
880
32
698
 13
13
111
88
92
 20
20
179
41
287
 61
61
533
49
862
 77
77
679
17
586
 6
6
53
89
40
 4
4
34
37
32
 76
76
668
175
675
 8
8
73
40
37
 6
6
53
12
24
 4
4
37
15
26
 5
5
42
20
42
 27
27
237
132
2157
 8
8
69
27
47
 14
14
123
93
94
 76
76
667
132
646
 17
17
153
29
137
 10
10
86
33
65
 11
11
98
20
74
 3
3
30
27
31
 7
7
59
29
46
 64
64
559
81
908
 7
7
59
43
42
 8
8
73
27
49
 10
10
91
27
64
 11
11
95
28
77
 85
85
752
36
684
 75
75
658
41
823
 26
26
227
83
380
 99
99
871
78
759
 17
17
152
66
195
Evolution
Species Conservation
PhosphoNET % Identity:
PhosphoNET % Similarity:
Homologene %
Identity:
PhosphoNET % Identity:
PhosphoNET % Similarity:
Homologene %
Identity:
 100
100
100
100 88.1
88.1
88.6
100 75
75
75.1
99.5 -
-
-
95 -
-
-
- 93.2
93.2
95.2
97 -
-
-
- 62.8
62.8
76.7
97 41
41
58
- -
-
-
- 82.2
82.2
86.2
- 89.4
89.4
94.6
91.5 40
40
57.5
87 40.5
40.5
57.4
80 -
-
-
- 28.5
28.5
40
49 45.7
45.7
62.3
- 46.9
46.9
63.1
52 53.4
53.4
66.2
- -
-
-
- -
-
-
- -
-
-
- 21.2
21.2
35
- 21.6
21.6
38.5
- -
-
-
-
For a wider analysis go to PhosphoNET Evolution in PhosphoNET
Binding Proteins
Examples of known interacting proteins
hiddentext
| No. | Name – UniProt ID |
|---|---|
| 1 | CREB1 - P16220 |
| 2 | BAD - Q92934 |
| 3 | HIST1H4A - P62805 |
| 4 | HMGN1 - P05114 |
| 5 | STAT3 - P40763 |
| 6 | ATF1 - P18846 |
| 7 | RELA - Q04206 |
| 8 | PLA2G4A - P47712 |
| 9 | TH - P07101 |
| 10 | STAT1 - P42224 |
| 11 | NR3C1 - P04150 |
| 12 | EGF - P01133 |
| 13 | MAPK11 - Q15759 |
| 14 | HSPB2 - Q16082 |
| 15 | MAPK1 - P28482 |
Regulation
Activation:
Activated by phosphorylation at Ser-212, Ser-360, Ser-376, Thr-581 and Thr-700.
Inhibition:
NA
Synthesis:
NA
Degradation:
NA
Known Upstream Kinases
For further details on these substrates click on the Substrate Short Name or UniProt ID. Phosphosite Location is hyperlinked to PhosphoNET
predictions.
Based on in vitro and/or in vivo phosphorylation data
| Kinase Short Name | UniProt ID (Human) | Phosphosite Location | Phosphosite Sequence | Effect of Phosphorylation |
|---|
| MSK1 | O75582 | S212 | DETERAYSFCGTIEY | + |
| p38a | Q16539 | S360 | TEMDPTYSPAALPQS | + |
| ERK1 | P27361 | S360 | TEMDPTYSPAALPQS | + |
| ERK2 | P28482 | S360 | TEMDPTYSPAALPQS | + |
| MSK1 | O75582 | S376 | EKLFQGYSFVAPSIL | + |
| MSK1 | O75582 | S381 | GYSFVAPSILFKRNA | |
| p38a | Q16539 | T581 | PDNQPLKTPCFTLHY | + |
| ERK1 | P27361 | T581 | PDNQPLKTPCFTLHY | + |
| ERK2 | P28482 | T581 | PDNQPLKTPCFTLHY | + |
| p38a | Q16539 | T700 | LSSNPLMTPDILGSS | + |
| ERK1 | P27361 | T700 | LSSNPLMTPDILGSS | + |
| ERK2 | P28482 | T700 | LSSNPLMTPDILGSS | + |
| MSK1 | O75582 | S750 | RRKMKKTSTSTETRS | |
| MSK1 | O75582 | S752 | KMKKTSTSTETRSSS | |
| MSK1 | O75582 | S758 | TSTETRSSSSESSHS |
Known Downstream Substrates
For further details on these substrates click on the Substrate Short Name or UniProt ID. Phosphosite Location is hyperlinked to PhosphoNET
predictions.
Based on in vitro and/or in vivo phosphorylation data
| Substrate Short Name | UniProt ID (Human) | Phosphosite Location | Phosphosite Sequence | Effect of Phosphorylation |
|---|
| 4E-BP1 | Q13541 | S64 | FLMECRNSPVTKTPP | |
| 4E-BP1 | Q13541 | T36 | PPGDYSTTPGGTLFS | |
| ATF1 | P18846 | S63 | GILARRPSYRKILKD | + |
| Bad | Q92934 | S118 | GRELRRMSDEFVDSF | - |
| Bad | Q92934 | S75 | EIRSRHSSYPAGTED | - |
| cPLA2 | P47712 | S727 | RQNPSRCSVSLSNVE | + |
| CREB1 | P16220 | S133 | EILSRRPSYRKILND | + |
| ETV1 (ER81) | P50549 | S191 | HRFRRQLSEPCNSFP | + |
| ETV1 (ER81) | P50549 | S216 | PMYQRQMSEPNIPFP | + |
| H2A.1 | P0C0S8 | S2 | ______MSGRGKQGG | - |
| H3.1 | P68431 | S11 | TKQTARKSTGGKAPR | + |
| H3.1 | P68431 | S29 | ATKAARKSAPATGGV | + |
| HMGN1 (HMG14) | P05114 | S20 | KEEPKRRSARLSAKP | |
| HMGN1 (HMG14) | P05114 | S24 | KRRSARLSAKPPAKV | |
| HMGN1 (HMG14) | P05114 | S6 | __PKRKVSSAEGAAK | |
| LKB1 (STK11) | Q15831 | S428 | SSKIRRLSACKQQ__ | + |
| MSK1 (RPS6KA5) | O75582 | S212 | DETERAYSFCGTIEY | + |
| MSK1 (RPS6KA5) | O75582 | S376 | EKLFQGYSFVAPSIL | + |
| MSK1 (RPS6KA5) | O75582 | S381 | GYSFVAPSILFKRNA | |
| MSK1 (RPS6KA5) | O75582 | S750 | RRKMKKTSTSTETRS | |
| MSK1 (RPS6KA5) | O75582 | S752 | KMKKTSTSTETRSSS | |
| MSK1 (RPS6KA5) | O75582 | S758 | TSTETRSSSSESSHS | |
| NFkB-p65 (RELA) | Q04206 | S276 | SMQLRRPSDRELSEP | |
| Nur77 | P22736 | S351 | GRRGRLPSKPKQPPD | - |
| STAT3 | P40763 | S727 | NTIDLPMSPRTLDSL | - |
| TH | P07101 | S71 | RFIGRRQSLIEDARK | |
| Wnk1 (PRKWNK1) | Q9H4A3 | T60 | EYRRRRHTMDKDSRG | + |
Protein Kinase Specificity
Matrix of observed frequency (%) of amino acids in aligned protein substrate phosphosites
Matrix Type:
Experimentally derived from alignment of 31 known protein substrate phosphosites and 49 peptides phosphorylated by recombinant MSK1 in vitro tested in-house by Kinexus.
Domain #:
1
Inhibitors
For further details on these inhibitors click on the Compound Name and enter it into DrugKiNET or click on the ID's
Based on in vitro and/or in vivo phosphorylation data
| Compound Name | KD, Ki or IC50 (nM) | PubChem ID | ChEMBL ID | PubMed ID |
|---|
Disease Linkage
General Disease Association:
Endocrine, and bone disorders
Specific Diseases (Non-cancerous):
Coffin-Lowry syndrome (CLS)
Comments:
The rare syndrome Coffin-Lowry Syndrome (CLS) is characterized by cognitive impairment, short stature, head, face, and skeletal abnormalities (including upper jaw deformation and curvature of the spine), broad nose, extensive brow, eyelid folds that are slanting downwards, widely-spaced eyes, and thick eyebrows. CLS can lead to issues eating, respiratory issues, cognitive impairment, developmental delay, impaired hearing, strange gait, stimulus-induced drop episodes, and heart or kidney issues.
Gene Expression in Cancers:
TranscriptoNET (www.transcriptonet.ca) analysis with mRNA expression data retrieved from the National Center for Biotechnology Information's Gene Expression Omnibus (GEO) database, which was normalized against 60 abundantly and commonly found proteins, indicated altered expression for this protein kinase as shown here as the percent change from normal tissue controls (%CFC) as supported with the Student T-test in the following types of human cancers: Brain glioblastomas (%CFC= +255, p<0.051); Cervical cancer stage 2B (%CFC= +108, p<0.085); and Clear cell renal cell carcinomas (cRCC) (%CFC= +51, p<0.001).
Mutagenesis Experiments:
Insertional mutagenesis studies in mice have not yet revealed a role for this protein kinase in mouse cancer oncogenesis. MSK1 phosphotransferase activity can be abrogated with a D195A or D565A mutation, while the N-terminal specifically can be inhibited with a S212A mutation. PMA or UV-C induced kinase phosphotransferase activity can be reduced 60% with a S360A mutation, plus a T700A/D can lead to decreased phosphorylation of T-581. Kinase phosphotransferase activity can also be lost either with a S376A mutation, leading to decreased phosphorylation of the S60 and T581 residues, or with a T581A mutation leading to decreased phosphorylation of S212, S376, or S381.
Mutation Rate in All Cancers:
Percent mutation rates per 100 amino acids length in human cancers: 0.06 % in 24867 diverse cancer specimens. This rate is only -23 % lower than the average rate of 0.075 % calculated for human protein kinases in general.
Frequency of Mutated Sites:
None > 4 in 20,654 cancer specimens
Comments:
Only 5 deletions, and no insertions or complex mutations are noted on the COSMIC website.