
Nomenclature
Short Name:
MSSK1
Full Name:
Serine-threonine-protein kinase 23
Alias:
- EC 2.7.11.1
- Kinase MSSK1
- SRPK3
- STK23
- MGC102944
- MSSK-1
- Muscle-specific serine kinase 1
- Serine/threonine protein kinase 23
Classification
Type:
Protein-serine/threonine kinase
Group:
CMGC
Family:
SRPK
SubFamily:
NA

Structure
Mol. Mass (Da):
58,997
# Amino Acids:
533
# mRNA Isoforms:
4
mRNA Isoforms:
62,014 Da (567 AA; Q9UPE1); 61,886 Da (566 AA; Q9UPE1-4); 58,997 Da (533 AA; Q9UPE1-3); 55,327 Da (491 AA; Q9UPE1-2)
4D Structure:
NA
1D Structure:
Subfamily Alignment
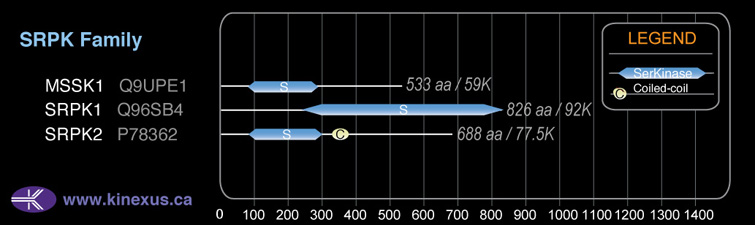
Domain Distribution:
| Start | End | Domain |
|---|---|---|
| 79 | 531 | Pkinase |
Post-translation Modifications
For detailed information on phosphorylation of this kinase go to PhosphoNET
Serine phosphorylated:
S2, S4, S330.
Threonine phosphorylated:
T5, T426.
Distribution
Based on gene microarray analysis from the NCBI
Human Tissue Distribution
% Max Expression:
Mean Expression:
Number of Samples:
Standard Deviation:
% Max Expression:
Mean Expression:
Number of Samples:
Standard Deviation:
 100
100
1295
16
2142
 5
5
66
10
56
 41
41
536
15
968
 53
53
682
60
1454
 33
33
424
14
411
 2
2
21
37
24
 28
28
360
19
679
 69
69
894
35
1115
 17
17
222
10
191
 18
18
232
58
567
 25
25
326
28
732
 49
49
632
109
658
 32
32
411
26
1195
 4
4
47
9
42
 37
37
484
25
1203
 5
5
70
8
36
 12
12
149
112
377
 25
25
323
22
574
 61
61
788
71
496
 23
23
292
56
324
 28
28
362
24
856
 26
26
339
26
1055
 50
50
650
16
1681
 19
19
242
22
407
 33
33
427
24
1125
 32
32
419
42
582
 19
19
247
29
755
 57
57
735
22
2434
 30
30
388
22
890
 6
6
84
14
23
 21
21
275
18
178
 63
63
813
21
934
 10
10
130
49
274
 68
68
886
26
763
 4
4
46
22
47
Evolution
Species Conservation
PhosphoNET % Identity:
PhosphoNET % Similarity:
Homologene %
Identity:
PhosphoNET % Identity:
PhosphoNET % Similarity:
Homologene %
Identity:
 100
100
100
100 70.2
70.2
81.6
97 68.3
68.3
80.3
98 -
-
-
96 -
-
-
- 87.9
87.9
89.9
96 -
-
-
- 89.7
89.7
91.2
96 89.7
89.7
90.9
94 -
-
-
- 69.2
69.2
78.6
- -
-
-
85 -
-
-
74 57.9
57.9
65.8
75 -
-
-
- 37
37
48.3
49 52.5
52.5
65
- 30.3
30.3
39
56 -
-
-
- 42.3
42.3
56.6
- -
-
-
- -
-
-
43 -
-
-
44 32.4
32.4
47
- -
-
-
-
For a wider analysis go to PhosphoNET Evolution in PhosphoNET
Binding Proteins
Examples of known interacting proteins
hiddentext
| No. | Name – UniProt ID |
|---|---|
| 1 | GBE1 - Q04446 |
| 2 | PRPF8 - Q6P2Q9 |
Regulation
Activation:
NA
Inhibition:
NA
Synthesis:
NA
Degradation:
NA
Protein Kinase Specificity
Matrix of observed frequency (%) of amino acids in aligned protein substrate phosphosites
Matrix Type:
Predicted from the application of the Kinexus Kinase Substrate Predictor Version 2.0 algorithm, which was trained with over 10,000 kinase-protein substrate pairs and 8,000 kinase-peptide substrate pairs.
Domain #:
1
Inhibitors
For further details on these inhibitors click on the Compound Name and enter it into DrugKiNET or click on the ID's
Based on in vitro and/or in vivo phosphorylation data
| Compound Name | KD, Ki or IC50 (nM) | PubChem ID | ChEMBL ID | PubMed ID |
|---|
Disease Linkage
General Disease Association:
Musculoskeletal disorders
Specific Diseases (Non-cancerous):
Centronuclear myopathy
Comments:
In animal studies, mice lacking MSSK1 display a type 2 fibre-specific myopathy characterized by an increase portion of cells with centrally placed nuclei. In addition, overexpressing SRPK3 in mice leads to severe muscle degeneration and lethality.
Gene Expression in Cancers:
The COSMIC website notes an up-regulated expression score for MSSK1 in diverse human cancers of 688, which is 1.5-fold of the average score of 462 for the human protein kinases. The down-regulated expression score of 161 for this protein kinase in human cancers was 2.7-fold of the average score of 60 for the human protein kinases.
Mutagenesis Experiments:
Insertional mutagenesis studies in mice have not yet revealed a role for this protein kinase in mouse cancer oncogenesis.
Mutation Rate in All Cancers:
Percent mutation rates per 100 amino acids length in human cancers: 0.06 % in 24914 diverse cancer specimens. This rate is only -25 % lower than the average rate of 0.075 % calculated for human protein kinases in general.
Mutation Rate in Specific Cancers:
Highest percent mutation rates per 100 amino acids length in human cancers: 0.21 % in 1270 large intestine cancers tested; 0.19 % in 589 stomach cancers tested; 0.17 % in 864 skin cancers tested; 0.16 % in 603 endometrium cancers tested; 0.1 % in 942 upper aerodigestive tract cancers tested; 0.1 % in 1822 lung cancers tested; 0.07 % in 548 urinary tract cancers tested; 0.07 % in 273 cervix cancers tested; 0.06 % in 1316 breast cancers tested; 0.05 % in 1512 liver cancers tested; 0.03 % in 558 thyroid cancers tested; 0.03 % in 2082 central nervous system cancers tested; 0.03 % in 1276 kidney cancers tested; 0.02 % in 881 prostate cancers tested; 0.01 % in 2009 haematopoietic and lymphoid cancers tested.
Frequency of Mutated Sites:
None > 3 in 20,197 cancer specimens
Comments:
Only 5 deletions, 1 insertion and no complex mutations are noted on the COSMIC website.