• KinATLAS
  • TranscriptoNET
  • PhosphoNET
  • OncoNET
  • KinaseNET
  • DrugKiNET
  • DrugProNET
  • KiNET-AM
  • Kinetica Online

Updated November 2019

Home | Kinexus | Contact | Credits

Nomenclature

Short Name:
MUSK
Full Name:
Muscle, skeletal receptor tyrosine protein kinase
Alias:
  • EC 2.7.10.1
  • MGC126323
  • MGC126324
  • Muscle specific tyrosine kinase receptor

Classification

Type:
Protein-tyrosine kinase
Group:
TK
Family:
Musk
SubFamily:
NA


Specific Links

BioCarta Entry: ach pathway
Entrez-Gene Entry: 4593
Entrez-Protein Entry: NP_005583
GeneCards Entry: MGC126323
KinBASE Entry: MUSK
OMIM Entry: 601296
Pfam Entry: O15146
PhosphoNET Entry: O15146
Phosphosite Plus Entry: 1947
Protein Data Bank Entry: 1LUF
ScanSite Entry: O15146
Source Entry: MUSK
UCSD-Nature Entry: A001567
UniProt Entry: O15146
Kinexus Products: MUSK
Muscle, skeletal receptor tyrosine protein kinase Y756 phosphosite-specific antibody AB-PK872
Muscle, skeletal receptor tyrosine-protein kinase (S752-N759, human) pY756 phosphopeptide - Powder PE-04ABM80
Muscle, skeletal receptor tyrosine-protein kinase (R748-N759, human) pY751+pY755+pY756 phosphopeptide - Powder PE-04AWQ90

General Links

ClustalW2
GPS-Cuckoo
Human Protein Atlas
Kinase.com
Kinase Research
Kinasource
Kinomer
Netphorest
NetworKIN
Phosida
PhosphoElm
Protein Blast
ScanSite
String

Structure

Mol. Mass (Da):
97,056
# Amino Acids:
869
# mRNA Isoforms:
3
mRNA Isoforms:
97,056 Da (869 AA; O15146); 87,598 Da (783 AA; O15146-2); 86,425 Da (773 AA; O15146-3)
4D Structure:
Interacts with DOK7, which probably regulates its activity By similarity. Interacts with PDZRN3; this interaction is enhanced by agrin
1D Structure:
Retrieve Gene Sequence
Retrieve Full Protein Sequence
Retrieve Catalytic Domain Sequence
 
3D Image (rendered using PV Viewer):

PDB ID
1LUF

Subfamily Alignment
subfamily domain
 
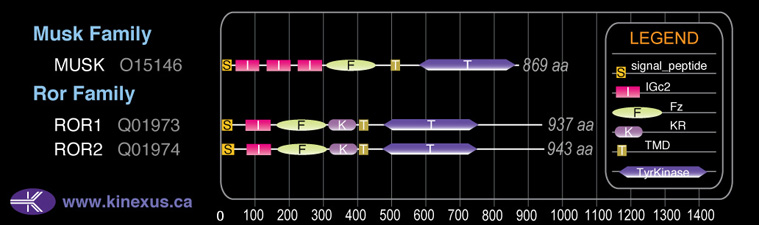
Domain Distribution:
Start End Domain
1 21 signal_peptide
28 116 IGc2
121 205 IGc2
212 302 IGc2
312 450 Fz
496 518 TMD
575 856 TyrKc
575 858 Pkinase
 

Kinexus Products

Click on entries below for direct links to relevant products from Kinexus for this protein kinase.
hiddentext
○ Muscle, skeletal receptor tyrosine protein kinase Y756 phosphosite-specific antibody AB-PK872
○ Muscle, skeletal receptor tyrosine-protein kinase (S752-N759, human) pY756 phosphopeptide - Powder PE-04ABM80
○ Muscle, skeletal receptor tyrosine-protein kinase (R748-N759, human) pY751+pY755+pY756 phosphopeptide - Powder PE-04AWQ90
 

Post-translation Modifications

For detailed information on phosphorylation of this kinase go to PhosphoNET
N-GlcNAcylated:
N222, N338.
Serine phosphorylated:

S293, S424, S430, S435.
Threonine phosphorylated:

T31, T294.
Tyrosine phosphorylated:

Y554+, Y577, Y751+, Y755+, Y756+, Y813.
 

Distribution

Based on gene microarray analysis from the NCBI
Human Tissue Distribution
% Max Expression:

Mean Expression:

Number of Samples:

Standard Deviation:
% Max Expression:

Mean Expression:

Number of Samples:

Standard Deviation:
  • adipose
    100

    630

    32

    1047

  • adrenal
    3

    22

    18

    27

  • bladder
    5

    32

    14

    39

  • brain
    33

    206

    123

    754

  • breast
    50

    313

    33

    237

  • cervix
    0.8

    5

    83

    5

  • colon
    30

    192

    45

    414

  • heart
    51

    320

    43

    453

  • intestine
    39

    248

    17

    201

  • kidney
    7

    44

    124

    74

  • liver
    5

    31

    41

    35

  • lung
    67

    421

    186

    456

  • lymphnode
    3

    17

    36

    20

  • ovary
    2

    13

    12

    15

  • pancreas
    5

    30

    21

    29

  • pituitary
    1

    7

    20

    10

  • prostate
    3

    20

    211

    20

  • salivarygland
    6

    37

    19

    40

  • skeletalmuscle"
    5

    30

    114

    27

  • skin
    43

    274

    137

    275

  • spinalcord
    3

    20

    33

    22

  • spleen
    3

    18

    32

    17

  • stomach
    4

    25

    17

    23

  • testis
    4

    26

    26

    22

  • thymus
    3

    21

    28

    24

  • thyroid
    56

    352

    71

    404

  • tonsil
    2

    14

    39

    11

  • trachea
    3

    20

    26

    23

  • uterus
    3

    20

    24

    26

  • reticulocytes"
    7

    45

    42

    45

  • t-lymphocytes
    36

    228

    24

    228

  • b-lymphocytes
    98

    618

    41

    867

  • neutrophils
    53

    333

    108

    905

  • macrophages
    90

    570

    78

    494

  • sperm
    5

    31

    48

    18


Evolution

Species Conservation
PhosphoNET % Identity:
PhosphoNET % Similarity:
Homologene %
Identity:
PhosphoNET % Identity:
PhosphoNET % Similarity:
Homologene %
Identity:
  • tableheader
    100

    100

    100
  • tableheader
    25.8

    42.9

    93
  • tableheader
    99.2

    99.5

    -
  • tableheader
    -

    -

    94
  • tableheader
    -

    -

    -
  • tableheader
    81

    82.6

    91
  • tableheader
    -

    -

    -
  • tableheader
    93.1

    96.4

    90
  • tableheader
    93.4

    96.9

    93
  • tableheader
    -

    -

    -
  • tableheader
    82.7

    90.3

    -
  • tableheader
    71.4

    81

    70
  • tableheader
    20.2

    35.5

    85
  • tableheader
    59.1

    70.8

    -
  • tableheader
    -

    -

    -
  • tableheader
    29.9

    45

    37
  • tableheader
    33.6

    48.3

    -
  • tableheader
    -

    -

    -
  • tableheader
    22.5

    40

    -
  • tableheader
    -

    -

    -
  • tableheader
    -

    -

    -
  • tableheader
    -

    -

    -
  • tableheader
    -

    -

    -
  • tableheader
    -

    -

    -
  • tableheader
    -

    -

    -
For a wider analysis go to PhosphoNET Evolution in PhosphoNET
 

Regulation

Activation:
NA
Inhibition:
NA
Synthesis:
NA
Degradation:
NA
 

Kinections Map

Click here to download a PPT of the image below
 
Kinections GIF
 

Known Upstream Kinases

For further details on these substrates click on the Substrate Short Name or UniProt ID. Phosphosite Location is hyperlinked to PhosphoNET predictions.
Based on in vitro and/or in vivo phosphorylation data

Kinase Short Name UniProt ID (Human) Phosphosite Location Phosphosite Sequence Effect of Phosphorylation
MUSK O15146 Y554 RLHPNPMYQRMPLLL +
MUSK O15146 Y577 YPRNNIEYVRDIGEG
MUSK O15146 Y755 RNIYSADYYKANEND +
MUSK O15146 Y756 NIYSADYYKANENDA +
MUSK O15146 Y813 MAHEEVIYYVRDGNI
 

Known Downstream Substrates

For further details on these substrates click on the Substrate Short Name or UniProt ID. Phosphosite Location is hyperlinked to PhosphoNET predictions.
Based on in vitro and/or in vivo phosphorylation data

Substrate Short Name UniProt ID (Human) Phosphosite Location Phosphosite Sequence Effect of Phosphorylation
MUSK O15146 Y554 RLHPNPMYQRMPLLL +
MUSK O15146 Y577 YPRNNIEYVRDIGEG
MUSK O15146 Y755 RNIYSADYYKANEND +
MUSK O15146 Y756 NIYSADYYKANENDA +
MUSK O15146 Y813 MAHEEVIYYVRDGNI
 

Protein Kinase Specificity

Matrix of observed frequency (%) of amino acids in aligned protein substrate phosphosites

Kinections GIF
Matrix Type:
Predicted from the application of the Kinexus Kinase Substrate Predictor Version 2.0 algorithm, which was trained with over 10,000 kinase-protein substrate pairs and 8,000 kinase-peptide substrate pairs.
Domain #:
1
 

Inhibitors

For further details on these inhibitors click on the Compound Name and enter it into DrugKiNET or click on the ID's
Based on in vitro and/or in vivo phosphorylation data
Compound Name KD, Ki or IC50 (nM) PubChem ID ChEMBL ID PubMed ID
AST-487 Kd = 3.1 nM 11409972 574738 18183025
Hesperadin Kd < 10 nM 10142586 514409 19035792
Linifanib Kd = 10 nM 11485656 223360 18183025
Foretinib Kd = 13 nM 42642645 1230609 22037378
Cdk1/2 Inhibitor III IC50 > 50 nM 5330812 261720 22037377
JAK3 Inhibitor VI IC50 > 50 nM 16760524 22037377
K-252a; Nocardiopsis sp. IC50 > 50 nM 3813 281948 22037377
Staurosporine Kd = 86 nM 5279 18183025
AT9283 IC50 > 100 nM 24905142 19143567
Lestaurtinib Kd = 100 nM 126565 18183025
SU14813 Kd = 100 nM 10138259 1721885 18183025
Sorafenib Kd = 130 nM 216239 1336 18183025
ACN-S001855 IC50 > 150 nM 10377751 22037377
AS601245 IC50 > 150 nM 11422035 191384 22037377
PKR Inhibitor IC50 > 150 nM 6490494 235641 22037377
SB218078 IC50 > 150 nM 447446 289422 22037377
TG003 IC50 > 150 nM 1893668 408982 22037377
Tozasertib Kd < 150 nM 5494449 572878 19035792
KW2449 Kd = 200 nM 11427553 1908397 22037378
Crizotinib Kd = 230 nM 11626560 601719 22037378
Gö6976 IC50 > 250 nM 3501 302449 22037377
NVP-TAE684 Kd = 260 nM 16038120 509032 22037378
Tozasertib Kd = 300 nM 5494449 572878 18183025
BMS-777607 IC50 = 450 nM 24794418 19260711
Sunitinib Kd = 490 nM 5329102 535 18183025
AG-E-60384 IC50 = 500 nM 6419741 413188 22037377
Aloisine A IC50 = 500 nM 5326843 75680 22037377
BML-275 IC50 = 500 nM 11524144 478629 22037377
Flt-3 Inhibitor II IC50 = 500 nM 11601743 377193 22037377
Gö6983 IC50 = 500 nM 3499 261491 22037377
GSK-3 Inhibitor XIII IC50 = 500 nM 6419766 359482 22037377
N-Benzoylstaurosporine IC50 = 500 nM 56603681 608533 22037377
PKCb Inhibitor IC50 = 500 nM 6419755 366266 22037377
STO609 IC50 = 500 nM 51371511 22037377
TBCA IC50 = 500 nM 1095828 22037377
Nintedanib Kd = 590 nM 9809715 502835 22037378
Ponatinib IC50 = 694 nM 24826799 20513156
Momelotinib IC50 < 750 nM 25062766 19295546
TG101348 Kd = 800 nM 16722836 1287853 22037378
Dovitinib Kd = 830 nM 57336746 18183025
1;9-Pyrazoloanthrone IC50 > 1 µM 8515 7064 22037377
Alisertib IC50 = 1 µM 24771867 22016509
Alsterpaullone IC50 > 1 µM 5005498 50894 22037377
Alsterpaullone; 2-Cyanoethyl IC50 > 1 µM 16760286 260138 22037377
Bohemine IC50 > 1 µM 2422 83980 22037377
Compound 52 IC50 > 1 µM 2856 22037377
GSK-3 Inhibitor X IC50 > 1 µM 6538818 430226 22037377
GSK-3b Inhibitor XI IC50 > 1 µM 10020713 272629 22037377
IDR E804 IC50 > 1 µM 6419764 1802727 22037377
IRAK-1-4 Inhibitor I IC50 > 1 µM 11983295 379787 22037377
MK5108 IC50 > 1 µM 24748204 20053775
PKR Inhibitor; Negative Control IC50 > 1 µM 16760619 22037377
Purvalanol A IC50 > 1 µM 456214 23327 22037377
Quizartinib Kd = 1 µM 24889392 576982 19654408
Silmitasertib IC50 > 1 µM 24748573 21174434
SNS314 IC50 > 1 µM 16047143 514582 18678489
SU11652 IC50 > 1 µM 24906267 13485 22037377
Tpl2 Kinase Inhibitor IC50 > 1 µM 9549300 22037377
TWS119 IC50 > 1 µM 9549289 405759 22037377
WZ3146 Kd > 1 µM 44607360 20033049
WZ4002 Kd > 1 µM 44607530 20033049
Barasertib Kd = 1.5 µM 16007391 215152 18183025
CHEMBL248757 Ki > 1.65 µM 44444843 248757 17935989
Doramapimod Kd = 1.9 µM 156422 103667 18183025
SureCN4875304 IC50 > 3.5 µM 46871765 20472445
JNJ-28871063 IC50 > 4 µM 17747413 17975007
 

Disease Linkage

General Disease Association:

Neurological, and endocrine disorders
Specific Diseases (Non-cancerous):

MUSK-related congenital myasthenic syndrome; Congenital myasthenic syndrome; Myasthenia gravis; Congenital myasthenic syndrome associated with acetylcholine receptor deficiency; Myasthenic syndrome, congenital, associated with facial dysmorphism and acetylcholine receptor deficiency; Lambert-Eaton myasthenic syndrome; Endplate acetylcholinesterase deficiency; Progressive bulbar palsy; Myasthenic syndrome, congenital, with pre- and postsynaptic defects
Comments:
Mutations of MUSK at M605I, A727V, and V790M are associated with myasthenic syndrome, congenital, associated with acetylcholine receptor deficiency (CMS-ACHRD). CMS-ACHRD is a post-synaptic congenital myasthenic syndrome with inherited disorders of neuromuscular transmission.
 
Gene Expression in Cancers:

The COSMIC website notes an up-regulated expression score for MUSK in diverse human cancers of 240, which is 48% lower than the average score of 462 for the human protein kinases. The down-regulated expression score of 0 for this protein kinase in human cancers was 100% lower than the average score of 60 for the human protein kinases.
Mutagenesis Experiments:

Insertional mutagenesis studies in mice have not yet revealed a role for this protein kinase in mouse cancer oncogenesis.
Mutation Rate in All Cancers:

Percent mutation rates per 100 amino acids length in human cancers: 0.09 % in 25406 diverse cancer specimens. This rate is only 22 % higher than the average rate of 0.075 % calculated for human protein kinases in general.
Mutation Rate in Specific Cancers:

Highest percent mutation rates per 100 amino acids length in human cancers: 0.55 % in 865 skin cancers tested; 0.42 % in 1329 large intestine cancers tested; 0.36 % in 603 endometrium cancers tested; 0.33 % in 589 stomach cancers tested; 0.14 % in 1956 lung cancers tested; 0.14 % in 1512 liver cancers tested; 0.08 % in 710 oesophagus cancers tested; 0.08 % in 273 cervix cancers tested; 0.08 % in 1276 kidney cancers tested; 0.07 % in 1490 breast cancers tested; 0.06 % in 833 ovary cancers tested; 0.05 % in 441 autonomic ganglia cancers tested; 0.04 % in 942 upper aerodigestive tract cancers tested; 0.04 % in 548 urinary tract cancers tested; 0.04 % in 1467 pancreas cancers tested.
Frequency of Mutated Sites:

Most frequent mutations with the number of reports indicated in brackets: E414Q (5).
Comments:
Only 2 deletions, 1 insertion, and no complex mutations are noted on the COSMIC website.
 
COSMIC Entry:
MUSK
OMIM Entry:
601296
  • Home
  • Top of Page
Copyright 2019 Kinexus BioInformatics Corporation