
Nomenclature
Short Name:
MYO3B
Full Name:
Myosin IIIB
Alias:
- EC 2.7.11.1
- MY3B
- Myosin 3b
Classification
Type:
Protein-serine/threonine kinase
Group:
STE
Family:
STE20
SubFamily:
NinaC

Structure
Mol. Mass (Da):
151829
# Amino Acids:
1341
# mRNA Isoforms:
7
mRNA Isoforms:
152,799 Da (1350 AA; Q8WXR4-7); 151,829 Da (1341 AA; Q8WXR4); 148,615 Da (1314 AA; Q8WXR4-4); 144,595 Da (1278 AA; Q8WXR4-2); 144,329 Da (1275 AA; Q8WXR4-5); 141,381 Da (1251 AA; Q8WXR4-3); 135,407 Da (1192 AA; Q8WXR4-6)
4D Structure:
NA
1D Structure:
Subfamily Alignment
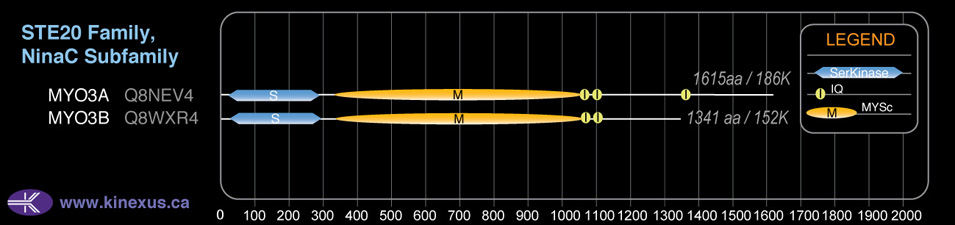
Domain Distribution:
Post-translation Modifications
For detailed information on phosphorylation of this kinase go to PhosphoNET
Serine phosphorylated:
S979, S1096, S1117, S1162, S1167, S1169, S1173, S1184.
Threonine phosphorylated:
T980, T1188.
Tyrosine phosphorylated:
Y495, Y514, Y993, Y1101.
Ubiquitinated:
K908.
Distribution
Based on gene microarray analysis from the NCBI
Human Tissue Distribution
% Max Expression:
Mean Expression:
Number of Samples:
Standard Deviation:
% Max Expression:
Mean Expression:
Number of Samples:
Standard Deviation:
 38
38
591
18
487
 32
32
490
8
910
 -
-
-
-
-
 6
6
85
76
516
 28
28
429
24
170
 0.4
0.4
6
27
8
 0.3
0.3
5
33
5
 30
30
459
7
805
 0.3
0.3
4
3
0
 23
23
348
7
614
 31
31
485
7
855
 43
43
656
25
369
 65
65
996
2
27
 61
61
935
5
1530
 34
34
521
7
1265
 6
6
96
17
280
 6
6
97
19
297
 35
35
532
5
819
 80
80
1239
5
1765
 37
37
575
74
842
 19
19
287
7
490
 0.6
0.6
9
5
3
 -
-
-
-
-
 100
100
1540
7
1505
 21
21
319
7
538
 30
30
457
53
389
 23
23
359
5
499
 45
45
686
5
1036
 51
51
783
5
1143
 -
-
-
-
-
 34
34
517
12
48
 74
74
1141
29
2723
 0.1
0.1
2
36
0
 36
36
562
78
485
 2
2
31
48
22
Evolution
Species Conservation
PhosphoNET % Identity:
PhosphoNET % Similarity:
Homologene %
Identity:
PhosphoNET % Identity:
PhosphoNET % Similarity:
Homologene %
Identity:
 100
100
100
100 98.3
98.3
98.6
99 97.5
97.5
98.5
97.5 -
-
-
92 -
-
-
- 44.8
44.8
56
92 -
-
-
- 84
84
89
87.5 84.8
84.8
89.6
88 -
-
-
- 50.9
50.9
63.5
- 72.9
72.9
78.6
81 -
-
-
79 55.3
55.3
62.9
75 -
-
-
- 28.9
28.9
48.4
- 39
39
56.2
- -
-
-
- -
-
-
- -
-
-
- -
-
-
- -
-
-
- -
-
-
- -
-
-
- -
-
-
-
For a wider analysis go to PhosphoNET Evolution in PhosphoNET
Regulation
Activation:
NA
Inhibition:
NA
Synthesis:
NA
Degradation:
NA
Protein Kinase Specificity
Matrix of observed frequency (%) of amino acids in aligned protein substrate phosphosites
Matrix Type:
Predicted from the application of the Kinexus Kinase Substrate Predictor Version 2.0 algorithm, which was trained with over 10,000 kinase-protein substrate pairs and 8,000 kinase-peptide substrate pairs.
Domain #:
1
Inhibitors
For further details on these inhibitors click on the Compound Name and enter it into DrugKiNET or click on the ID's
Based on in vitro and/or in vivo phosphorylation data
| Compound Name | KD, Ki or IC50 (nM) | PubChem ID | ChEMBL ID | PubMed ID |
|---|
Disease Linkage
General Disease Association:
Eye disorders
Specific Diseases (Non-cancerous):
Bardet-Biedl syndrome (BBS5)
Comments:
It has been suggested that this class III myosin is a potential candidate for Bardet-Biedl syndrome. The MYO3B gene maps to 2q31.1-q31.2, which is a region that overlaps the locus for a Bardet-Biedl syndrome (BBS5) linked to markers at 2q31. Mutations in NINAC, a Drosophila melanogaster homologue of MYO3A and MYO3B, cause retinal degeneration in the fly.
Gene Expression in Cancers:
The COSMIC website notes an up-regulated expression score for MYO3B in diverse human cancers of 375, which is 0.8-fold of the average score of 462 for the human protein kinases. The down-regulated expression score of 0 for this protein kinase in human cancers was 100% lower than the average score of 60 for the human protein kinases.
Mutagenesis Experiments:
Insertional mutagenesis studies in mice have not yet revealed a role for this protein kinase in mouse cancer oncogenesis.
Mutation Rate in All Cancers:
Percent mutation rates per 100 amino acids length in human cancers: 0.09 % in 24914 diverse cancer specimens. This rate is only 24 % higher than the average rate of 0.075 % calculated for human protein kinases in general.
Mutation Rate in Specific Cancers:
Highest percent mutation rates per 100 amino acids length in human cancers: 0.5 % in 864 skin cancers tested; 0.41 % in 1270 large intestine cancers tested; 0.27 % in 589 stomach cancers tested; 0.23 % in 603 endometrium cancers tested; 0.16 % in 1822 lung cancers tested; 0.14 % in 273 cervix cancers tested; 0.11 % in 833 ovary cancers tested; 0.11 % in 1512 liver cancers tested; 0.09 % in 238 bone cancers tested; 0.07 % in 548 urinary tract cancers tested; 0.07 % in 1459 pancreas cancers tested; 0.05 % in 710 oesophagus cancers tested; 0.04 % in 1316 breast cancers tested; 0.04 % in 1276 kidney cancers tested; 0.03 % in 942 upper aerodigestive tract cancers tested; 0.03 % in 881 prostate cancers tested; 0.03 % in 441 autonomic ganglia cancers tested; 0.02 % in 382 soft tissue cancers tested; 0.02 % in 2082 central nervous system cancers tested; 0.02 % in 2009 haematopoietic and lymphoid cancers tested.
Frequency of Mutated Sites:
Most frequent mutations with the number of reports indicated in brackets: C431R (4); S867P (3).
Comments:
Only 7 deletion, 1 insertion and no complex mutations are noted on the COSMIC website.