
Nomenclature
Short Name:
NDR2
Full Name:
Serine-threonine-protein kinase 38-like
Alias:
- EC 2.7.11.1
- KIAA0965
- NDR2 protein kinase
- ST38L
- STK38L
Classification
Type:
Protein-serine/threonine kinase
Group:
AGC
Family:
NDR
SubFamily:
NA

Structure
Mol. Mass (Da):
54,003
# Amino Acids:
464
# mRNA Isoforms:
2
mRNA Isoforms:
54,003 Da (464 AA; Q9Y2H1); 43,170 Da (371 AA; Q9Y2H1-2)
4D Structure:
Homodimeric S100B binds two molecules of STK38L By similarity. Interacts with MOB1 and MOB2.
1D Structure:
Subfamily Alignment
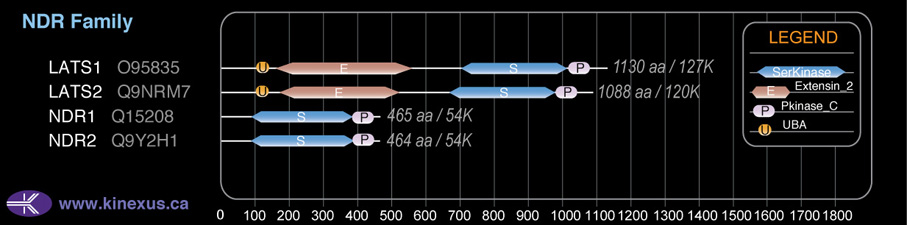
Domain Distribution:
Post-translation Modifications
For detailed information on phosphorylation of this kinase go to PhosphoNET
Acetylated:
A2.
Serine phosphorylated:
S265, S282+.
Threonine phosphorylated:
T75+, T236, T283+, T286-, T442+, T450.
Tyrosine phosphorylated:
Y116, Y289, Y441, Y443.
Ubiquitinated:
K94, K215, K224.
Distribution
Based on gene microarray analysis from the NCBI
Human Tissue Distribution
% Max Expression:
Mean Expression:
Number of Samples:
Standard Deviation:
% Max Expression:
Mean Expression:
Number of Samples:
Standard Deviation:
 20
20
832
29
754
 1.1
1.1
47
14
41
 5
5
228
2
254
 14
14
599
89
802
 22
22
912
25
724
 3
3
132
81
188
 7
7
278
31
350
 26
26
1083
37
2104
 14
14
595
17
454
 2
2
83
71
59
 1.2
1.2
52
20
48
 19
19
789
151
668
 2
2
67
24
50
 1.2
1.2
49
12
59
 2
2
66
15
76
 2
2
79
14
56
 8
8
326
111
2464
 1.4
1.4
57
10
58
 2
2
99
77
68
 17
17
698
109
669
 2
2
78
13
79
 2
2
100
15
110
 3
3
130
4
105
 1.5
1.5
61
11
82
 1.2
1.2
49
13
75
 29
29
1210
55
1724
 2
2
82
27
69
 2
2
74
10
103
 3
3
116
11
146
 3
3
126
28
68
 13
13
560
24
472
 100
100
4192
36
8872
 5
5
216
70
595
 24
24
1004
52
760
 2
2
82
35
96
Evolution
Species Conservation
PhosphoNET % Identity:
PhosphoNET % Similarity:
Homologene %
Identity:
PhosphoNET % Identity:
PhosphoNET % Similarity:
Homologene %
Identity:
 100
100
100
100 88.8
88.8
88.8
100 88.8
88.8
88.8
100 -
-
-
99 -
-
-
- 83.1
83.1
83.3
99 74.3
74.3
74.5
- -
-
-
98 97.4
97.4
98.7
98 -
-
-
- -
-
-
- 88.7
88.7
92.1
93.5 88.7
88.7
92.1
95 92
92
95.9
- 89.9
89.9
94.2
- -
-
-
71 68.1
68.1
84
- -
-
-
67.5 63
63
75.2
- -
-
-
- -
-
-
- -
-
-
50 -
-
-
50 -
-
-
52 33.6
33.6
46.7
45
For a wider analysis go to PhosphoNET Evolution in PhosphoNET
Binding Proteins
Examples of known interacting proteins
hiddentext
| No. | Name – UniProt ID |
|---|---|
| 1 | MOBKL1B - Q9H8S9 |
| 2 | KRT31 - Q15323 |
Regulation
Activation:
Activated by binding of S100B which releases autoinhibitory N-lobe interactions, enabling ATP to bind and the autophosphorylation of Ser-282. Thr-442 then undergoes calcium-dependent phosphorylation by an upstream kinase. Interactions between phosphorylated Thr-442 and the N-lobe promote additional structural changes that complete the activation of the kinase.
Inhibition:
Autoinhibition is also released by the binding of MOB1/MOBKL1A and MOB2/HCCA2 to the N-terminal of STK38L.
Synthesis:
NA
Degradation:
NA
Known Upstream Kinases
For further details on these substrates click on the Substrate Short Name or UniProt ID. Phosphosite Location is hyperlinked to PhosphoNET
predictions.
Based on in vitro and/or in vivo phosphorylation data
| Kinase Short Name | UniProt ID (Human) | Phosphosite Location | Phosphosite Sequence | Effect of Phosphorylation |
|---|
Known Downstream Substrates
For further details on these substrates click on the Substrate Short Name or UniProt ID. Phosphosite Location is hyperlinked to PhosphoNET
predictions.
Based on in vitro and/or in vivo phosphorylation data
| Substrate Short Name | UniProt ID (Human) | Phosphosite Location | Phosphosite Sequence | Effect of Phosphorylation |
|---|
| AAK1 | Q2M2I8 | S637 | AGHRRILSDVTHSAV | ? |
| NDR2 (STK38L) | Q9Y2H1 | S282 | NRRQLAYSTVGTPDY | + |
| NuaK1 (ARK5) | O60285 | T211 | QKDKFLQTFCGSPLY | + |
| p21/Cip1 | P38936 | S146 | GRKRRQTSMTDFYHS | ? |
| PI4KB (suspected) | Q9UBF8 | S277 | RTHQRSKSDATASIS | |
| Rab11flp5 (suspected) | Q9BXF6 | S307 | FTHKRTYSDEANQMR | |
| Rab3IP (Rabin8) | Q96QF0 | S288 | KGHTRNKSTSSAMSG | ? |
Protein Kinase Specificity
Matrix of observed frequency (%) of amino acids in aligned protein substrate phosphosites
Matrix Type:
Predicted from the application of the Kinexus Kinase Substrate Predictor Version 2.0 algorithm, which was trained with over 10,000 kinase-protein substrate pairs and 8,000 kinase-peptide substrate pairs.
Domain #:
1
Inhibitors
For further details on these inhibitors click on the Compound Name and enter it into DrugKiNET or click on the ID's
Based on in vitro and/or in vivo phosphorylation data
| Compound Name | KD, Ki or IC50 (nM) | PubChem ID | ChEMBL ID | PubMed ID |
|---|
| Hesperadin | Kd < 10 nM | 10142586 | 514409 | 19035792 |
| Staurosporine | Kd = 28 nM | 5279 | 18183025 | |
| Lestaurtinib | Kd = 370 nM | 126565 | 22037378 | |
| NVP-TAE684 | Kd = 580 nM | 16038120 | 509032 | 22037378 |
| Sunitinib | Kd = 970 nM | 5329102 | 535 | 18183025 |
| WZ3146 | Kd > 1 µM | 44607360 | 20033049 | |
| WZ4002 | Kd > 1 µM | 44607530 | 20033049 | |
| KW2449 | Kd = 1.1 µM | 11427553 | 1908397 | 22037378 |
| SU14813 | Kd = 2 µM | 10138259 | 1721885 | 18183025 |
| AST-487 | Kd = 2.1 µM | 11409972 | 574738 | 22037378 |
| 1;9-Pyrazoloanthrone | Kd = 2.3 µM | 8515 | 7064 | 15711537 |
| BMS-690514 | Kd < 3 µM | 11349170 | 21531814 | |
| Pelitinib | Kd = 3.1 µM | 6445562 | 607707 | 15711537 |
Disease Linkage
General Disease Association:
Cancer, Infectious disease
Specific Diseases (Non-cancerous):
HIV
Comments:
Like NDR1, NDR2 is found incorporated into HIV-1 particles, and it is speculated that they may play a role in the HIV-1 life cycle.
Specific Cancer Types:
Colorectal cancer (CRC)
Comments:
IGF-1 indirectly induces the activation of NDR2, which in turn directly phosphorylates the activatory T211 site of the tumour progression factor ARK5, which promotes cell survival and invasion of colorectal cancer cell lines.
Gene Expression in Cancers:
TranscriptoNET (www.transcriptonet.ca) analysis with mRNA expression data retrieved from the National Center for Biotechnology Information's Gene Expression Omnibus (GEO) database, which was normalized against 60 abundantly and commonly found proteins, indicated altered expression for this protein kinase as shown here as the percent change from normal tissue controls (%CFC) as supported with the Student T-test in the following types of human cancers: Brain glioblastomas (%CFC= -77, p<0.029); Brain oligodendrogliomas (%CFC= -92, p<0.01); Cervical cancer (%CFC= +84, p<0.079); Cervical cancer stage 1B (%CFC= +85, p<0.041); Cervical cancer stage 2B (%CFC= +123, p<0.018); and Skin melanomas - malignant (%CFC= -55, p<0.016). The COSMIC website notes an up-regulated expression score for NDR2 in diverse human cancers of 531, which is 1.2-fold of the average score of 462 for the human protein kinases. The down-regulated expression score of 19 for this protein kinase in human cancers was 0.3-fold of the average score of 60 for the human protein kinases.
Mutagenesis Experiments:
Insertional mutagenesis studies in mice have not yet revealed a role for this protein kinase in mouse cancer oncogenesis.
Mutation Rate in All Cancers:
Percent mutation rates per 100 amino acids length in human cancers: 0.06 % in 25459 diverse cancer specimens. This rate is only -19 % lower than the average rate of 0.075 % calculated for human protein kinases in general.
Mutation Rate in Specific Cancers:
Highest percent mutation rates per 100 amino acids length in human cancers: 0.35 % in 1093 large intestine cancers tested; 0.35 % in 805 skin cancers tested.
Frequency of Mutated Sites:
None > 5 in 20,742 cancer specimens
Comments:
No deletions, insertions or complex mutations are noted on the COSMIC website.