
Nomenclature
Short Name:
NEK4
Full Name:
Serine-threonine-protein kinase Nek4
Alias:
- EC 2.7.11.1
- Kinase Nek4
- Serine/threonine protein kinase 2
- Serine/threonine protein kinase-2
- STK2
- NIMA (never in mitosis gene a)-related kinase 4
- NimA-related protein kinase 4
- NRK2
- Pp12301
Classification
Type:
Protein-serine/threonine kinase
Group:
Other
Family:
NEK
SubFamily:
NA

Structure
Mol. Mass (Da):
94597
# Amino Acids:
841
# mRNA Isoforms:
3
mRNA Isoforms:
94,597 Da (841 AA; P51957); 88,094 Da (781 AA; P51957-2); 84,348 Da (752 AA; P51957-3)
4D Structure:
NA
1D Structure:
Subfamily Alignment
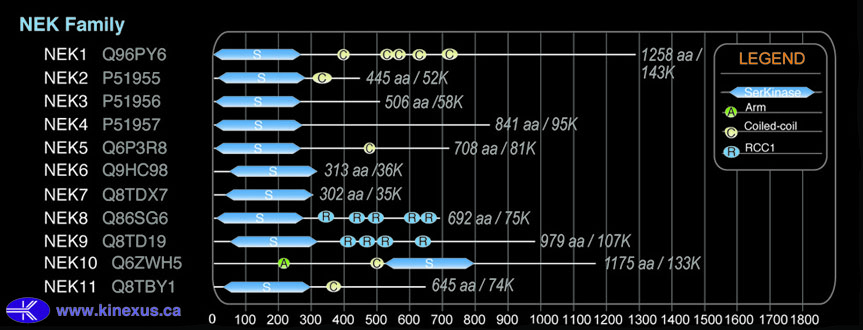
Domain Distribution:
| Start | End | Domain |
|---|---|---|
| 6 | 261 | Pkinase |
Post-translation Modifications
For detailed information on phosphorylation of this kinase go to PhosphoNET
Acetylated:
K273, K275, K278, K647.
Methylated:
K622.
Serine phosphorylated:
S43, S44, S243, S340, S343, S377, S461, S474, S481, S482, S484, S487, S489, S533, S563, S608, S629, S630, S631, S634, S639, S661, S677, S691.
Threonine phosphorylated:
T356.
Tyrosine phosphorylated:
Y216, Y319, Y695.
Distribution
Based on gene microarray analysis from the NCBI
Human Tissue Distribution
% Max Expression:
Mean Expression:
Number of Samples:
Standard Deviation:
% Max Expression:
Mean Expression:
Number of Samples:
Standard Deviation:
 86
86
1023
22
1073
 4
4
52
11
22
 28
28
328
14
280
 47
47
560
82
1316
 59
59
697
21
546
 4
4
50
51
71
 16
16
193
29
378
 30
30
360
33
454
 35
35
414
10
391
 11
11
128
58
210
 23
23
276
26
329
 40
40
476
124
540
 20
20
239
25
265
 6
6
66
9
33
 29
29
350
24
424
 6
6
66
13
57
 6
6
71
117
140
 18
18
209
21
204
 11
11
130
56
165
 48
48
566
79
548
 24
24
283
23
329
 16
16
190
24
281
 24
24
290
23
352
 100
100
1189
21
1533
 20
20
240
23
257
 60
60
709
57
627
 13
13
159
28
276
 19
19
228
21
221
 29
29
341
21
405
 5
5
54
14
28
 35
35
419
18
264
 27
27
316
26
405
 23
23
268
61
561
 65
65
778
57
699
 37
37
438
35
477
Evolution
Species Conservation
PhosphoNET % Identity:
PhosphoNET % Similarity:
Homologene %
Identity:
PhosphoNET % Identity:
PhosphoNET % Similarity:
Homologene %
Identity:
 100
100
100
100 88.4
88.4
88.6
99 25.5
25.5
42.5
95 -
-
-
82 -
-
-
99 73
73
80.2
82 -
-
-
- 72.3
72.3
80.5
78 72.4
72.4
79.8
78 -
-
-
- 57.1
57.1
68
- 58.9
58.9
71.7
61 21.1
21.1
37.7
53 25.9
25.9
43.6
70 -
-
-
- -
-
-
- -
-
-
- -
-
-
- -
-
-
- -
-
-
- -
-
-
- -
-
-
- 26.6
26.6
44.4
- -
-
-
- 21
21
39.3
-
For a wider analysis go to PhosphoNET Evolution in PhosphoNET
Regulation
Activation:
NA
Inhibition:
NA
Synthesis:
NA
Degradation:
NA
Protein Kinase Specificity
Matrix of observed frequency (%) of amino acids in aligned protein substrate phosphosites
Matrix Type:
Predicted from the application of the Kinexus Kinase Substrate Predictor Version 2.0 algorithm, which was trained with over 10,000 kinase-protein substrate pairs and 8,000 kinase-peptide substrate pairs.
Domain #:
1
Inhibitors
For further details on these inhibitors click on the Compound Name and enter it into DrugKiNET or click on the ID's
Based on in vitro and/or in vivo phosphorylation data
| Compound Name | KD, Ki or IC50 (nM) | PubChem ID | ChEMBL ID | PubMed ID |
|---|
| JAK3 Inhibitor VI | IC50 > 150 nM | 16760524 | 22037377 | |
| K-252a; Nocardiopsis sp. | IC50 > 150 nM | 3813 | 281948 | 22037377 |
| SB218078 | IC50 > 150 nM | 447446 | 289422 | 22037377 |
| Bosutinib | IC50 > 250 nM | 5328940 | 288441 | 22037377 |
| PKR Inhibitor | IC50 > 250 nM | 6490494 | 235641 | 22037377 |
| AST-487 | Kd = 460 nM | 11409972 | 574738 | 22037378 |
| Gö6976 | IC50 = 500 nM | 3501 | 302449 | 22037377 |
| Staurosporine | IC50 = 500 nM | 5279 | 22037377 | |
| TBCA | IC50 = 500 nM | 1095828 | 22037377 | |
| BCP9000906 | IC50 > 1 µM | 5494425 | 21156 | 22037377 |
| Cdk1/2 Inhibitor III | IC50 > 1 µM | 5330812 | 261720 | 22037377 |
| STO609 | IC50 > 1 µM | 51371511 | 22037377 | |
| WZ3146 | Kd > 1 µM | 44607360 | 20033049 | |
| WZ4002 | Kd > 1 µM | 44607530 | 20033049 | |
| KW2449 | Kd = 1.1 µM | 11427553 | 1908397 | 22037378 |
| TG101348 | Kd = 1.6 µM | 16722836 | 1287853 | 22037378 |
| Dovitinib | Kd = 2.7 µM | 57336746 | 22037378 |
Disease Linkage
General Disease Association:
Genetic disorders
Specific Diseases (Non-cancerous):
Coffin-Lowry syndrome (CLS)
Comments:
Coffin-Lowry Syndrome (CLS) is a rare genetic disorder characterized by craniofacial (head and face) and skeletal abnormalities, mental retardation, short statue, and hypotonia. The condition often affects male more severely than females. CLS is caused by a defective gene on the X-chromosome, explaining the increased severity in males which lack a second X chromosome for compensation.
Gene Expression in Cancers:
TranscriptoNET (www.transcriptonet.ca) analysis with mRNA expression data retrieved from the National Center for Biotechnology Information's Gene Expression Omnibus (GEO) database, which was normalized against 60 abundantly and commonly found proteins, indicated altered expression for this protein kinase as shown here as the percent change from normal tissue controls (%CFC) as supported with the Student T-test in the following types of human cancers: Bladder carcinomas (%CFC= +144, p<0.007); Brain oligodendrogliomas (%CFC= -62, p<(0.0003); Breast epithelial hyperplastic enlarged lobular units (HELU) (%CFC= +155, p<0.049); Cervical cancer stage 2B (%CFC= +488); and T-cell prolymphocytic leukemia (%CFC= +99, p<0.024). The COSMIC website notes an up-regulated expression score for NEK4 in diverse human cancers of 272, which is 0.6-fold of the average score of 462 for the human protein kinases. The down-regulated expression score of 286 for this protein kinase in human cancers was 4.8-fold of the average score of 60 for the human protein kinases.
Mutagenesis Experiments:
Insertional mutagenesis studies in mice have not yet revealed a role for this protein kinase in mouse cancer oncogenesis.
Mutation Rate in All Cancers:
Percent mutation rates per 100 amino acids length in human cancers: 0.05 % in 24752 diverse cancer specimens. This rate is only -34 % lower than the average rate of 0.075 % calculated for human protein kinases in general.
Mutation Rate in Specific Cancers:
Highest percent mutation rates per 100 amino acids length in human cancers: 0.26 % in 1093 large intestine cancers tested; 0.16 % in 805 skin cancers tested.
Frequency of Mutated Sites:
None > 3 in 20,034 cancer specimens
Comments:
Only 1 deletion, and no insertions or complex mutations are noted on the COSMIC website.