
Nomenclature
Short Name:
NEK5
Full Name:
Serine-threonine-protein kinase Nek5
Alias:
- EC 2.7.11.1
- MGC75495
Classification
Type:
Protein-serine/threonine kinase
Group:
Other
Family:
NEK
SubFamily:
NA

Structure
Mol. Mass (Da):
81,445
# Amino Acids:
708
# mRNA Isoforms:
1
mRNA Isoforms:
81,445 Da (708 AA; Q6P3R8)
4D Structure:
NA
1D Structure:
Subfamily Alignment
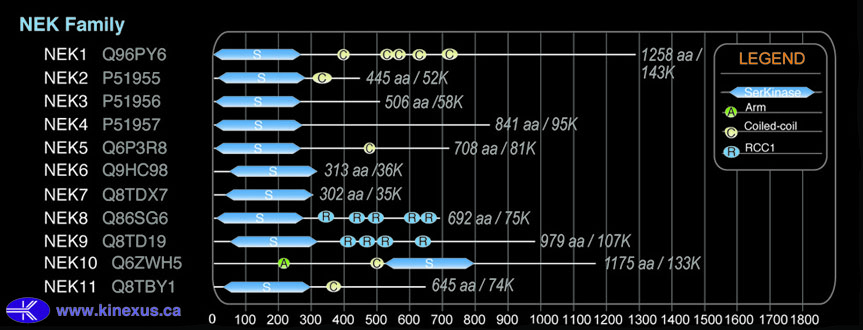
Domain Distribution:
| Start | End | Domain |
|---|---|---|
| 4 | 259 | Pkinase |
| 467 | 487 | Coiled-coil |
Post-translation Modifications
For detailed information on phosphorylation of this kinase go to PhosphoNET
Acetylated:
K556.
Tyrosine phosphorylated:
Y362, Y477.
Distribution
Based on gene microarray analysis from the NCBI
Human Tissue Distribution
% Max Expression:
Mean Expression:
Number of Samples:
Standard Deviation:
% Max Expression:
Mean Expression:
Number of Samples:
Standard Deviation:
 -
-
-
-
-
 -
-
-
-
-
 -
-
-
-
-
 72
72
347
2
68
 -
-
-
-
-

 -
-
-
-
-
 96
96
461
2
230
 -
-
-
-
-
 100
100
479
2
34
 39
39
189
2
92
 52
52
249
2
123
 -
-
-
-
-
 -
-
-
-
-
 83
83
399
2
11
 -
-
-
-
-
 99
99
476
2
150
 -
-
-
-
-
 -
-
-
-
-
 -
-
-
-
-
 60
60
289
2
92
 70
70
334
2
109
 -
-
-
-
-
 -
-
-
-
-
 95
95
454
2
93
 -
-
-
-
-
 -
-
-
-
-
 -
-
-
-
-
 -
-
-
-
-
 -
-
-
-
-
 -
-
-
-
-
 -
-
-
-
-
 -
-
-
-
-
 -
-
-
-
-
 7
7
35
9
66
Evolution
Species Conservation
PhosphoNET % Identity:
PhosphoNET % Similarity:
Homologene %
Identity:
PhosphoNET % Identity:
PhosphoNET % Similarity:
Homologene %
Identity:
 100
100
100
100 99.3
99.3
99.6
99 96.2
96.2
97.5
96 -
-
-
78 -
-
-
- 27.6
27.6
40.5
- -
-
-
- 39.7
39.7
52.8
73 38
38
52
74 -
-
-
- 47.8
47.8
61
- 36.4
36.4
52
56 22.4
22.4
39.7
57 24.4
24.4
41.4
- -
-
-
- -
-
-
- -
-
-
- -
-
-
- -
-
-
- -
-
-
- -
-
-
- -
-
-
- 24.7
24.7
41
- -
-
-
- 23.1
23.1
41.7
-
For a wider analysis go to PhosphoNET Evolution in PhosphoNET
Regulation
Activation:
NA
Inhibition:
NA
Synthesis:
NA
Degradation:
NA
Protein Kinase Specificity
Matrix of observed frequency (%) of amino acids in aligned protein substrate phosphosites
Matrix Type:
Predicted from the application of the Kinexus Kinase Substrate Predictor Version 2.0 algorithm, which was trained with over 10,000 kinase-protein substrate pairs and 8,000 kinase-peptide substrate pairs.
Domain #:
1
Inhibitors
For further details on these inhibitors click on the Compound Name and enter it into DrugKiNET or click on the ID's
Based on in vitro and/or in vivo phosphorylation data
| Compound Name | KD, Ki or IC50 (nM) | PubChem ID | ChEMBL ID | PubMed ID |
|---|
| R406 | Kd = 13 nM | 11984591 | 22037378 | |
| TG101348 | Kd = 570 nM | 16722836 | 1287853 | 22037378 |
| Staurosporine | Kd = 810 nM | 5279 | 18183025 | |
| PD173955 | Kd = 890 nM | 447077 | 386051 | 22037378 |
| WZ3146 | Kd > 1 µM | 44607360 | 20033049 | |
| WZ4002 | Kd > 1 µM | 44607530 | 20033049 | |
| AST-487 | Kd = 1.1 µM | 11409972 | 574738 | 18183025 |
| GSK461364A | Kd = 1.1 µM | 15983966 | 1908394 | 22037378 |
| Dovitinib | Kd = 2.3 µM | 57336746 | 18183025 | |
| KW2449 | Kd = 2.3 µM | 11427553 | 1908397 | 22037378 |
| RAF265 | Kd = 3.2 µM | 11656518 | 558752 | 18183025 |
| Tozasertib | Kd = 4.2 µM | 5494449 | 572878 | 18183025 |
Disease Linkage
Gene Expression in Cancers:
The COSMIC website notes an up-regulated expression score for NEK5 in diverse human cancers of 377, which is 0.8-fold of the average score of 462 for the human protein kinases. The down-regulated expression score of 2 for this protein kinase in human cancers was 97% lower than the average score of 60 for the human protein kinases.
Mutagenesis Experiments:
Insertional mutagenesis studies in mice have not yet revealed a role for this protein kinase in mouse cancer oncogenesis.
Mutation Rate in All Cancers:
Percent mutation rates per 100 amino acids length in human cancers: 0.09 % in 24846 diverse cancer specimens. This rate is only 19 % higher than the average rate of 0.075 % calculated for human protein kinases in general.
Mutation Rate in Specific Cancers:
Highest percent mutation rates per 100 amino acids length in human cancers: 0.64 % in 864 skin cancers tested; 0.57 % in 273 cervix cancers tested; 0.34 % in 1270 large intestine cancers tested; 0.18 % in 1634 lung cancers tested; 0.13 % in 548 urinary tract cancers tested; 0.12 % in 589 stomach cancers tested; 0.09 % in 1062 upper aerodigestive tract cancers tested; 0.07 % in 1512 liver cancers tested; 0.06 % in 441 autonomic ganglia cancers tested; 0.05 % in 881 prostate cancers tested; 0.05 % in 603 endometrium cancers tested; 0.04 % in 710 oesophagus cancers tested.
Frequency of Mutated Sites:
Most frequent mutations with the number of reports indicated in brackets: E517K (5); R485C (3).
Comments:
Only 2 deletions, 2 insertions, and no complex mutations are noted on the COSMIC website.