
Nomenclature
Short Name:
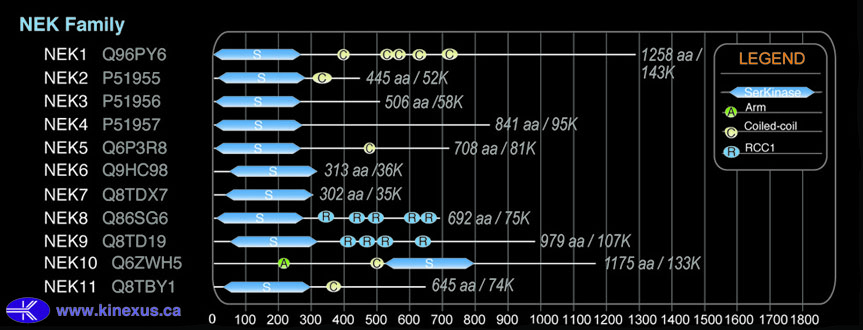
NEK9
Full Name:
Serine-threonine-protein kinase Nek9
Alias:
- DKFZp434D0935
- EC 2.7.11.1
- NERCC
- Nercc1 kinase
- Never in mitosis A-related kinase 9
- NIMA (never in mitosis gene a)- related kinase 9; NimA-related protein kinase 9; NimA-related kinase 8
- KIAA1995
- MGC16714
- MGC138306
- Nek8
Classification
Type:
Protein-serine/threonine kinase
Group:
Other
Family:
NEK
SubFamily:
NA

Structure
Mol. Mass (Da):
107168
# Amino Acids:
979
# mRNA Isoforms:
1
mRNA Isoforms:
107,168 Da (979 AA; Q8TD19)
4D Structure:
Homodimer. Binds to Ran GTPase. Has a greater affinity for Ran-GDP over Ran-GTP. Interacts with NEK6, NEK7 and BICD2. Interacts with SSRP1 and SUPT16H, the 2 subunits of the FACT complex.
1D Structure:
Subfamily Alignment
Domain Distribution:
Post-translation Modifications
For detailed information on phosphorylation of this kinase go to PhosphoNET
Acetylated:
K731.
Serine phosphorylated:
S2, S13, S16, S20+, S28, S29, S35, S76, S203+, S331, S332, S357, S413, S735, S741, S750, S793, S801, S827, S829, S832, S836, S838, S855, S868, S869, S944+, S978.
Threonine phosphorylated:
T72, T210+, T254, T326, T333, T335, T358, T685, T732, T842, T877, T883, T886, .
Tyrosine phosphorylated:
Y52, Y350, Y509, Y520, Y845+.
Ubiquitinated:
K199, K262, K327, K366, K525.
Distribution
Based on gene microarray analysis from the NCBI
Human Tissue Distribution
% Max Expression:
Mean Expression:
Number of Samples:
Standard Deviation:
% Max Expression:
Mean Expression:
Number of Samples:
Standard Deviation:
 26
26
1240
35
1624
 2
2
96
16
81
 3
3
136
8
112
 7
7
331
115
780
 15
15
725
32
631
 1.3
1.3
64
83
70
 4
4
193
41
447
 11
11
527
42
708
 9
9
447
17
428
 2
2
98
106
99
 2
2
82
31
75
 16
16
752
179
701
 3
3
134
30
91
 2
2
115
12
103
 2
2
84
19
86
 3
3
145
20
150
 9
9
435
126
2834
 2
2
84
17
122
 4
4
179
101
150
 11
11
544
137
569
 3
3
129
23
150
 2
2
108
27
141
 2
2
80
18
92
 2
2
112
17
107
 3
3
137
23
190
 13
13
609
73
740
 2
2
98
33
72
 2
2
78
17
68
 2
2
117
17
104
 4
4
183
42
136
 9
9
436
24
227
 100
100
4824
46
8160
 4
4
187
110
513
 18
18
854
83
787
 2
2
117
48
169
Evolution
Species Conservation
PhosphoNET % Identity:
PhosphoNET % Similarity:
Homologene %
Identity:
PhosphoNET % Identity:
PhosphoNET % Similarity:
Homologene %
Identity:
 100
100
100
100 0
0
0
100 99.4
99.4
99.4
99.5 -
-
-
96 -
-
-
- 95.7
95.7
96.8
97 -
-
-
- 95
95
96.4
96 93.6
93.6
95
96 -
-
-
- 44.8
44.8
48.9
- 76
76
81.4
86 69.5
69.5
80.1
75 24.1
24.1
41
56 -
-
-
- -
-
-
- -
-
-
- -
-
-
- 40.2
40.2
52.8
- -
-
-
- -
-
-
- -
-
-
- 21.6
21.6
35.6
- -
-
-
- -
-
-
-
For a wider analysis go to PhosphoNET Evolution in PhosphoNET
Binding Proteins
Examples of known interacting proteins
hiddentext
| No. | Name – UniProt ID |
|---|---|
| 1 | NEK6 - Q9HC98 |
| 2 | SSRP1 - Q08945 |
| 3 | NEK7 - Q8TDX7 |
| 4 | SUPT16H - Q9Y5B9 |
| 5 | CSN2 - P05814 |
| 6 | BICD2 - Q8TD16 |
| 7 | MBP - P02686 |
| 8 | RAN - P62826 |
| 9 | GABARAPL2 - P60520 |
Regulation
Activation:
Activated during mitosis by intramolecular autophosphorylation. Activity and autophosphorylation is activated by manganese >> magnesium ions. Sensitive to increasing concentration of detergents. It is not cell-cycle regulated but activity is higher in G0-arrested cells.
Inhibition:
NA
Synthesis:
NA
Degradation:
NA
Known Upstream Kinases
For further details on these substrates click on the Substrate Short Name or UniProt ID. Phosphosite Location is hyperlinked to PhosphoNET
predictions.
Based on in vitro and/or in vivo phosphorylation data
| Kinase Short Name | UniProt ID (Human) | Phosphosite Location | Phosphosite Sequence | Effect of Phosphorylation |
|---|
Known Downstream Substrates
For further details on these substrates click on the Substrate Short Name or UniProt ID. Phosphosite Location is hyperlinked to PhosphoNET
predictions.
Based on in vitro and/or in vivo phosphorylation data
| Substrate Short Name | UniProt ID (Human) | Phosphosite Location | Phosphosite Sequence | Effect of Phosphorylation |
|---|
Protein Kinase Specificity
Matrix of observed frequency (%) of amino acids in aligned protein substrate phosphosites
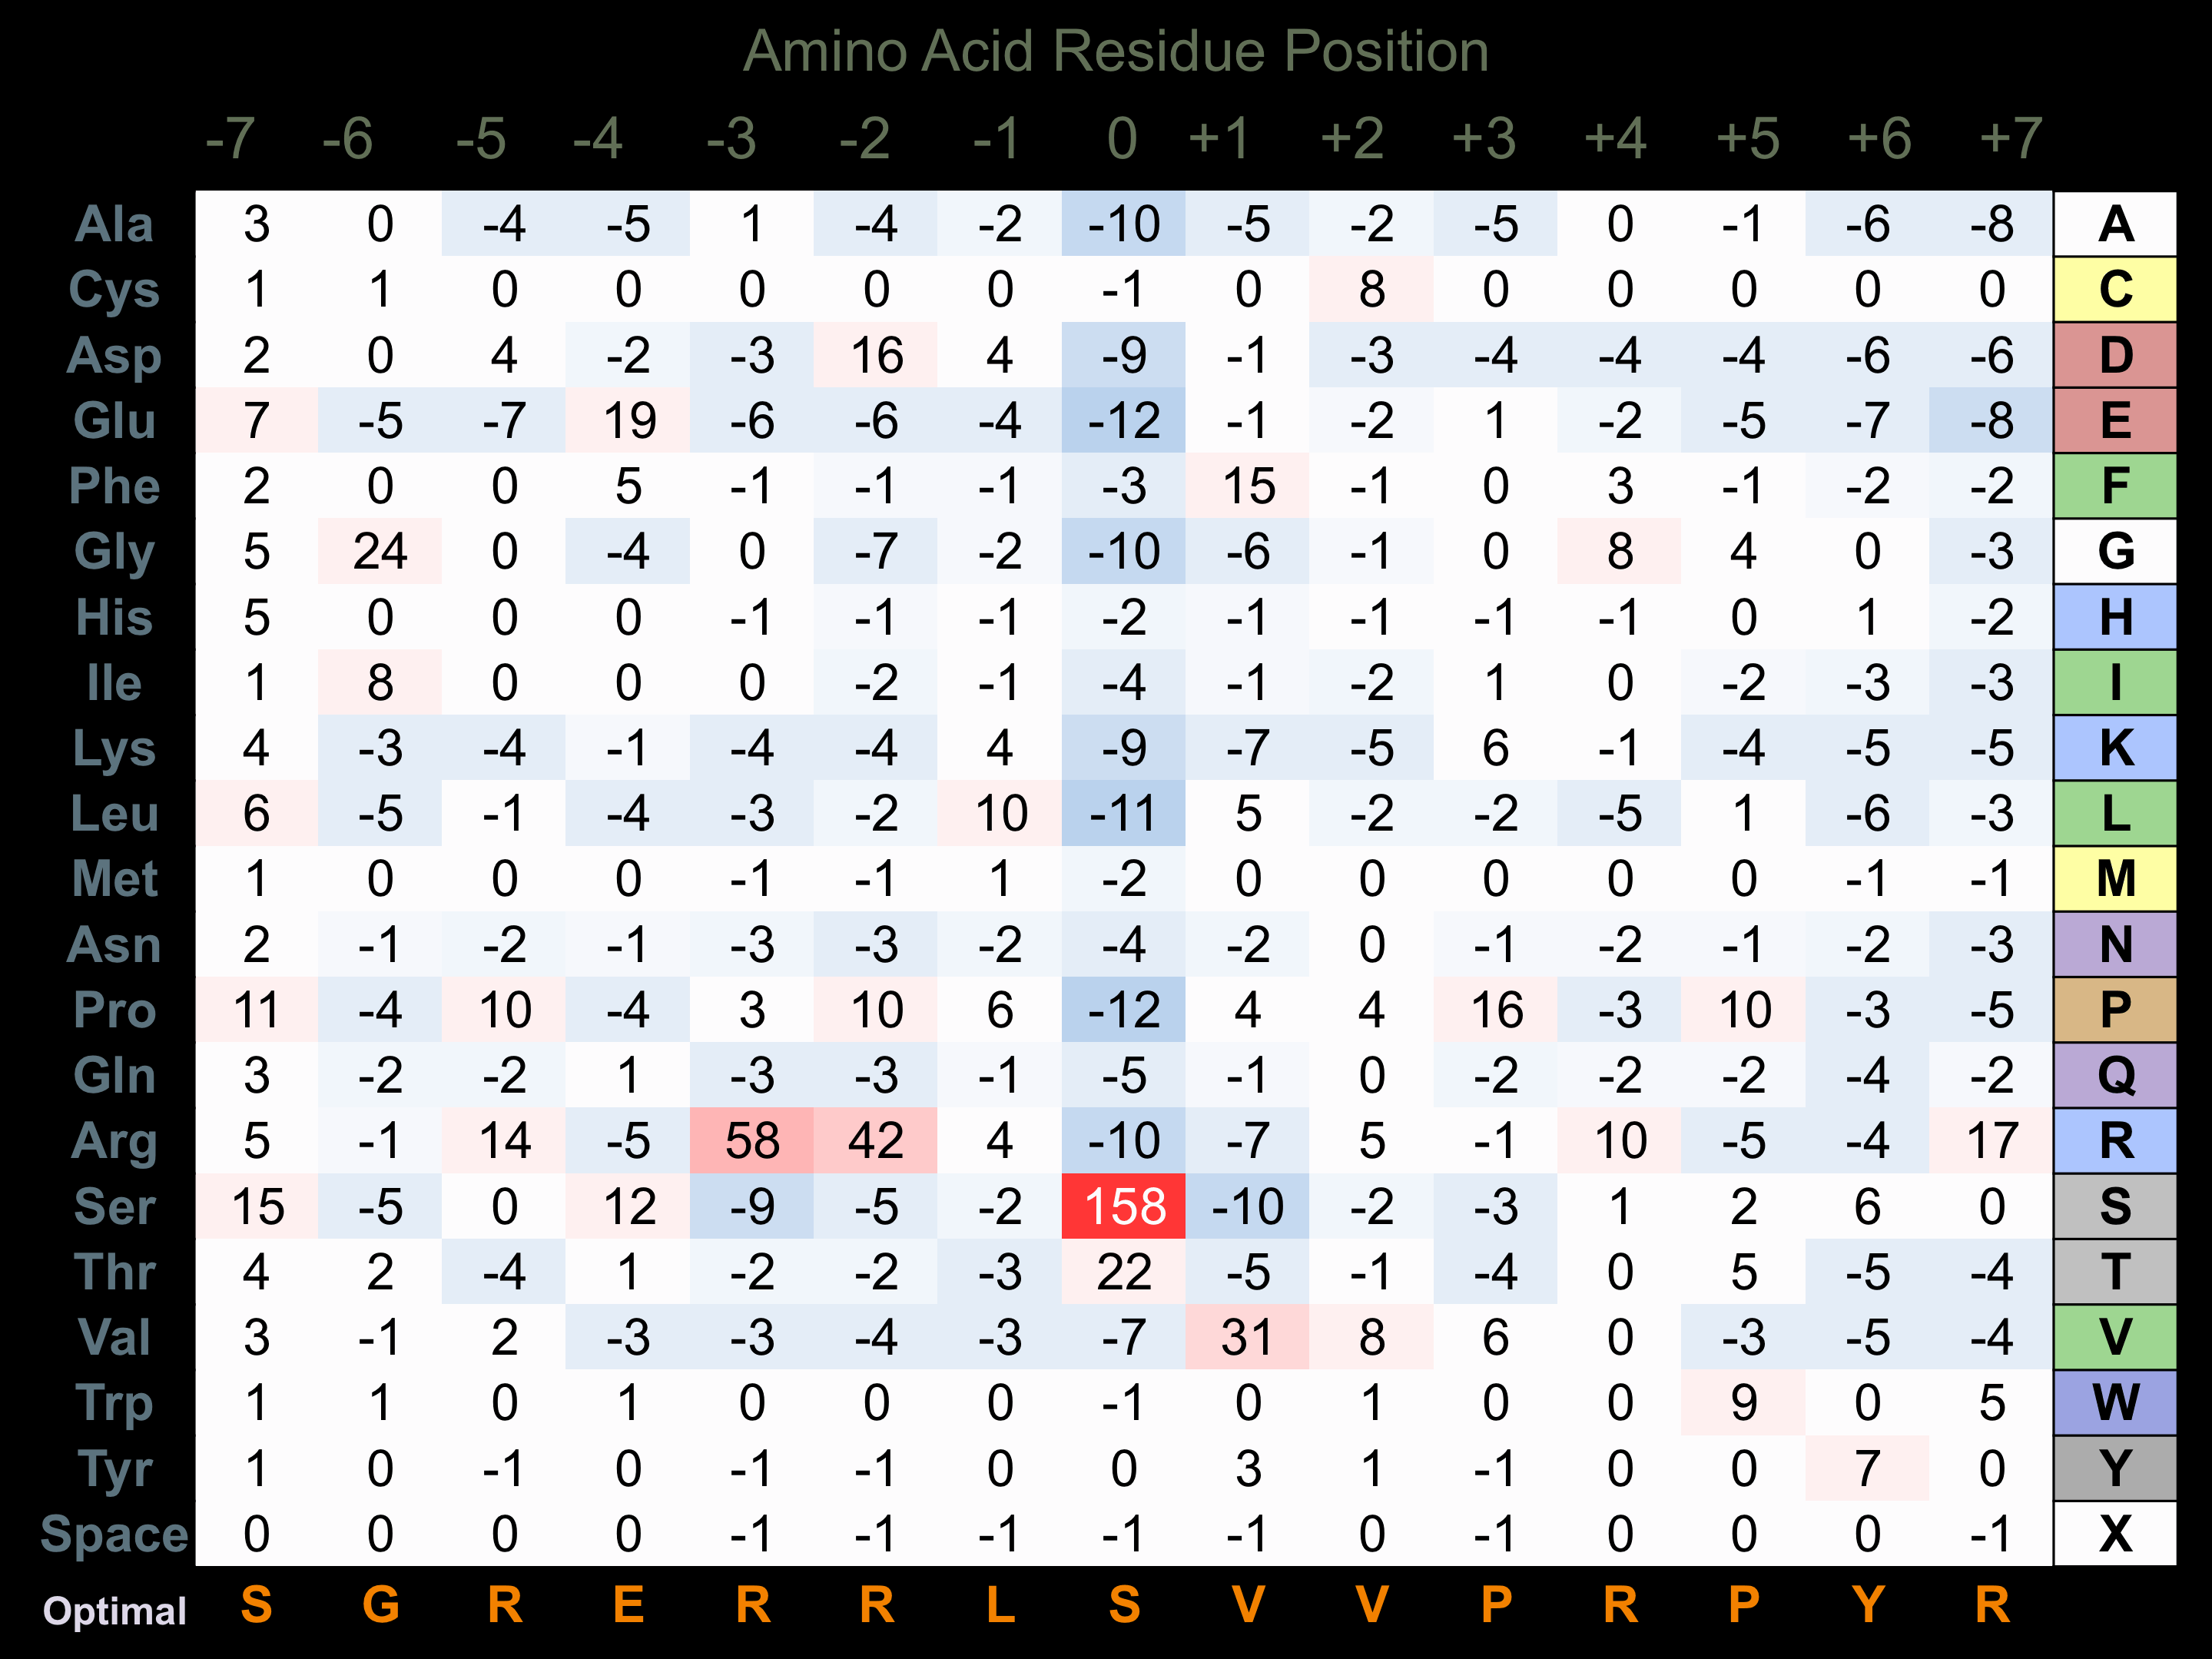
Matrix Type:
Predicted from the application of the Kinexus Kinase Substrate Predictor Version 2.0 algorithm, which was trained with over 10,000 kinase-protein substrate pairs and 8,000 kinase-peptide substrate pairs.
Domain #:
1
Inhibitors
For further details on these inhibitors click on the Compound Name and enter it into DrugKiNET or click on the ID's
Based on in vitro and/or in vivo phosphorylation data
| Compound Name | KD, Ki or IC50 (nM) | PubChem ID | ChEMBL ID | PubMed ID |
|---|
| Syk Inhibitor | IC50 > 1 µM | 6419747 | 104279 | 22037377 |
| WZ3146 | Kd > 1 µM | 44607360 | 20033049 | |
| WZ4002 | Kd > 1 µM | 44607530 | 20033049 | |
| AST-487 | Kd = 1.8 µM | 11409972 | 574738 | 22037378 |
| R406 | Kd = 16 nM | 11984591 | 22037378 | |
| K-252a; Nocardiopsis sp. | IC50 > 150 nM | 3813 | 281948 | 22037377 |
| SB218078 | IC50 > 150 nM | 447446 | 289422 | 22037377 |
| Staurosporine | IC50 > 150 nM | 5279 | 22037377 | |
| TG101348 | Kd = 150 nM | 16722836 | 1287853 | 22037378 |
| Cdk1/2 Inhibitor III | IC50 > 250 nM | 5330812 | 261720 | 22037377 |
| PKR Inhibitor | IC50 > 250 nM | 6490494 | 235641 | 22037377 |
| Foretinib | Kd = 470 nM | 42642645 | 1230609 | 22037378 |
| KW2449 | Kd = 520 nM | 11427553 | 1908397 | 22037378 |
| Momelotinib | IC50 < 750 nM | 25062766 | 19295546 | |
| Crizotinib | Kd = 790 nM | 11626560 | 601719 | 22037378 |
| NVP-TAE684 | Kd = 800 nM | 16038120 | 509032 | 22037378 |
| Aloisine A | IC50 > 1 µM | 5326843 | 75680 | 22037377 |
| JAK3 Inhibitor VI | IC50 > 1 µM | 16760524 | 22037377 | |
| N-Benzoylstaurosporine | IC50 > 1 µM | 56603681 | 608533 | 22037377 |
Disease Linkage
Gene Expression in Cancers:
TranscriptoNET (www.transcriptonet.ca) analysis with mRNA expression data retrieved from the National Center for Biotechnology Information's Gene Expression Omnibus (GEO) database, which was normalized against 60 abundantly and commonly found proteins, indicated altered expression for this protein kinase as shown here as the percent change from normal tissue controls (%CFC) as supported with the Student T-test in the following types of human cancers: Cervical cancer (%CFC= -45, p<0.006); Clear cell renal cell carcinomas (cRCC) stage I (%CFC= -95, p<0.0002); and Ovary adenocarcinomas (%CFC= -55, p<0.029). The COSMIC website notes an up-regulated expression score for NEK9 in diverse human cancers of 326, which is 0.7-fold of the average score of 462 for the human protein kinases. The down-regulated expression score of 442 for this protein kinase in human cancers was 7.4-fold of the average score of 60 for the human protein kinases.
Mutagenesis Experiments:
Insertional mutagenesis studies in mice have not yet revealed a role for this protein kinase in mouse cancer oncogenesis.
Mutation Rate in All Cancers:
Percent mutation rates per 100 amino acids length in human cancers: 0.05 % in 24751 diverse cancer specimens. This rate is only -37 % lower than the average rate of 0.075 % calculated for human protein kinases in general.
Mutation Rate in Specific Cancers:
Highest percent mutation rates per 100 amino acids length in human cancers: 0.24 % in 864 skin cancers tested; 0.21 % in 1270 large intestine cancers tested; 0.14 % in 603 endometrium cancers tested; 0.11 % in 273 cervix cancers tested; 0.1 % in 589 stomach cancers tested; 0.09 % in 1634 lung cancers tested; 0.08 % in 1316 breast cancers tested; 0.07 % in 548 urinary tract cancers tested; 0.05 % in 881 prostate cancers tested; 0.04 % in 238 bone cancers tested; 0.03 % in 1512 liver cancers tested; 0.03 % in 1276 kidney cancers tested; 0.02 % in 833 ovary cancers tested; 0.02 % in 441 autonomic ganglia cancers tested; 0.02 % in 1459 pancreas cancers tested; 0.01 % in 958 upper aerodigestive tract cancers tested; 0.01 % in 710 oesophagus cancers tested.
Frequency of Mutated Sites:
Most frequent mutations with the number of reports indicated in brackets: R786Q (3).
Comments:
Only 1 deletion and 2 insertions and no complex mutations are noted on the COSMIC website.