
Nomenclature
Short Name:
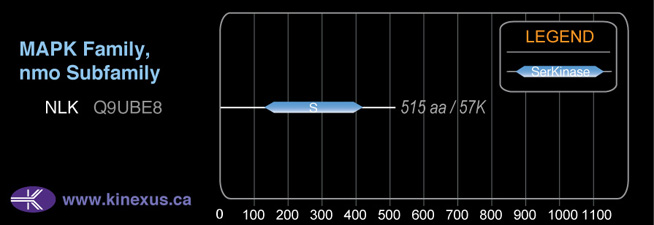
NLK
Full Name:
Serine-threonine protein kinase NLK
Alias:
- Kinase NLK
- LAK1
- Nemo-like kinase
Classification
Type:
Protein-serine/threonine kinase
Group:
CMGC
Family:
MAPK
SubFamily:
nmo

Specific Links
Structure
Mol. Mass (Da):
58283
# Amino Acids:
527
# mRNA Isoforms:
1
mRNA Isoforms:
58,283 Da (527 AA; Q9UBE8)
4D Structure:
Interacts with STAT3 By similarity. Interacts with RNF138/NARF and TCF7L2/TCF4. Interacts with HIPK2 and MYB.
1D Structure:
Subfamily Alignment
Domain Distribution:
| Start | End | Domain |
|---|---|---|
| 138 | 427 | Pkinase |
Kinexus Products
Click on entries below for direct links to relevant products from Kinexus for this protein kinase.
hiddentext
Post-translation Modifications
For detailed information on phosphorylation of this kinase go to PhosphoNET
Serine phosphorylated:
S274, S385, S522+.
Threonine phosphorylated:
T286+, T291-, T298+, T303+, T367.
Tyrosine phosphorylated:
Y434.
Distribution
Based on gene microarray analysis from the NCBI
Human Tissue Distribution
% Max Expression:
Mean Expression:
Number of Samples:
Standard Deviation:
% Max Expression:
Mean Expression:
Number of Samples:
Standard Deviation:
 85
85
1256
28
978
 10
10
153
10
84
 4
4
57
11
33
 39
39
581
108
530
 54
54
797
34
592
 12
12
182
63
444
 5
5
77
35
47
 30
30
448
33
1009
 24
24
349
10
306
 9
9
128
95
97
 4
4
57
26
52
 45
45
662
100
604
 4
4
57
22
41
 4
4
58
6
39
 7
7
110
23
69
 13
13
188
17
107
 2
2
36
264
26
 3
3
49
16
25
 5
5
69
83
39
 41
41
609
112
528
 10
10
148
22
74
 7
7
101
24
55
 5
5
74
12
52
 5
5
80
16
47
 6
6
93
22
53
 58
58
859
72
860
 5
5
67
25
40
 4
4
58
16
28
 4
4
62
16
39
 8
8
122
42
79
 53
53
789
18
545
 100
100
1481
31
3379
 15
15
222
76
425
 63
63
937
78
747
 35
35
511
48
667
Evolution
Species Conservation
PhosphoNET % Identity:
PhosphoNET % Similarity:
Homologene %
Identity:
PhosphoNET % Identity:
PhosphoNET % Similarity:
Homologene %
Identity:
 100
100
100
100 97.7
97.7
97.7
100 89
89
89.6
100 -
-
-
100 -
-
-
99 97.5
97.5
97.7
100 -
-
-
- 99.8
99.8
99.8
100 -
-
-
100 -
-
-
- 76.6
76.6
78.7
- 96.5
96.5
96.7
99 66
66
73.8
95 94.5
94.5
95.8
98.5 79.5
79.5
81.9
- 64.3
64.3
73.8
80 63.3
63.3
73
- 46.5
46.5
57.7
66 61.1
61.1
71.9
- -
-
-
- -
-
-
- -
-
-
- 32.6
32.6
46.8
- -
-
-
- -
-
-
-
For a wider analysis go to PhosphoNET Evolution in PhosphoNET
Binding Proteins
Examples of known interacting proteins
hiddentext
| No. | Name – UniProt ID |
|---|---|
| 1 | LEF1 - Q9UJU2 |
| 2 | MYB - P10242 |
| 3 | MAP3K7 - O43318 |
| 4 | CREBBP - Q92793 |
| 5 | FBXW5 - Q969U6 |
| 6 | FBXW4 - P57775 |
| 7 | CUL1 - Q13616 |
| 8 | SKP2 - Q13309 |
| 9 | TCF7L2 - Q9NQB0 |
| 10 | CTNNB1 - P35222 |
| 11 | HIPK2 - Q9H2X6 |
| 12 | STAT3 - P40763 |
| 13 | ASGR1 - P07306 |
| 14 | ATXN1 - P54253 |
Regulation
Activation:
Activated by tyrosine and threonine phosphorylation By similarity. Activated by activin.
Inhibition:
NA
Synthesis:
NA
Degradation:
NA
Known Downstream Substrates
For further details on these substrates click on the Substrate Short Name or UniProt ID. Phosphosite Location is hyperlinked to PhosphoNET
predictions.
Based on in vitro and/or in vivo phosphorylation data
| Substrate Short Name | UniProt ID (Human) | Phosphosite Location | Phosphosite Sequence | Effect of Phosphorylation |
|---|
Protein Kinase Specificity
Matrix of observed frequency (%) of amino acids in aligned protein substrate phosphosites
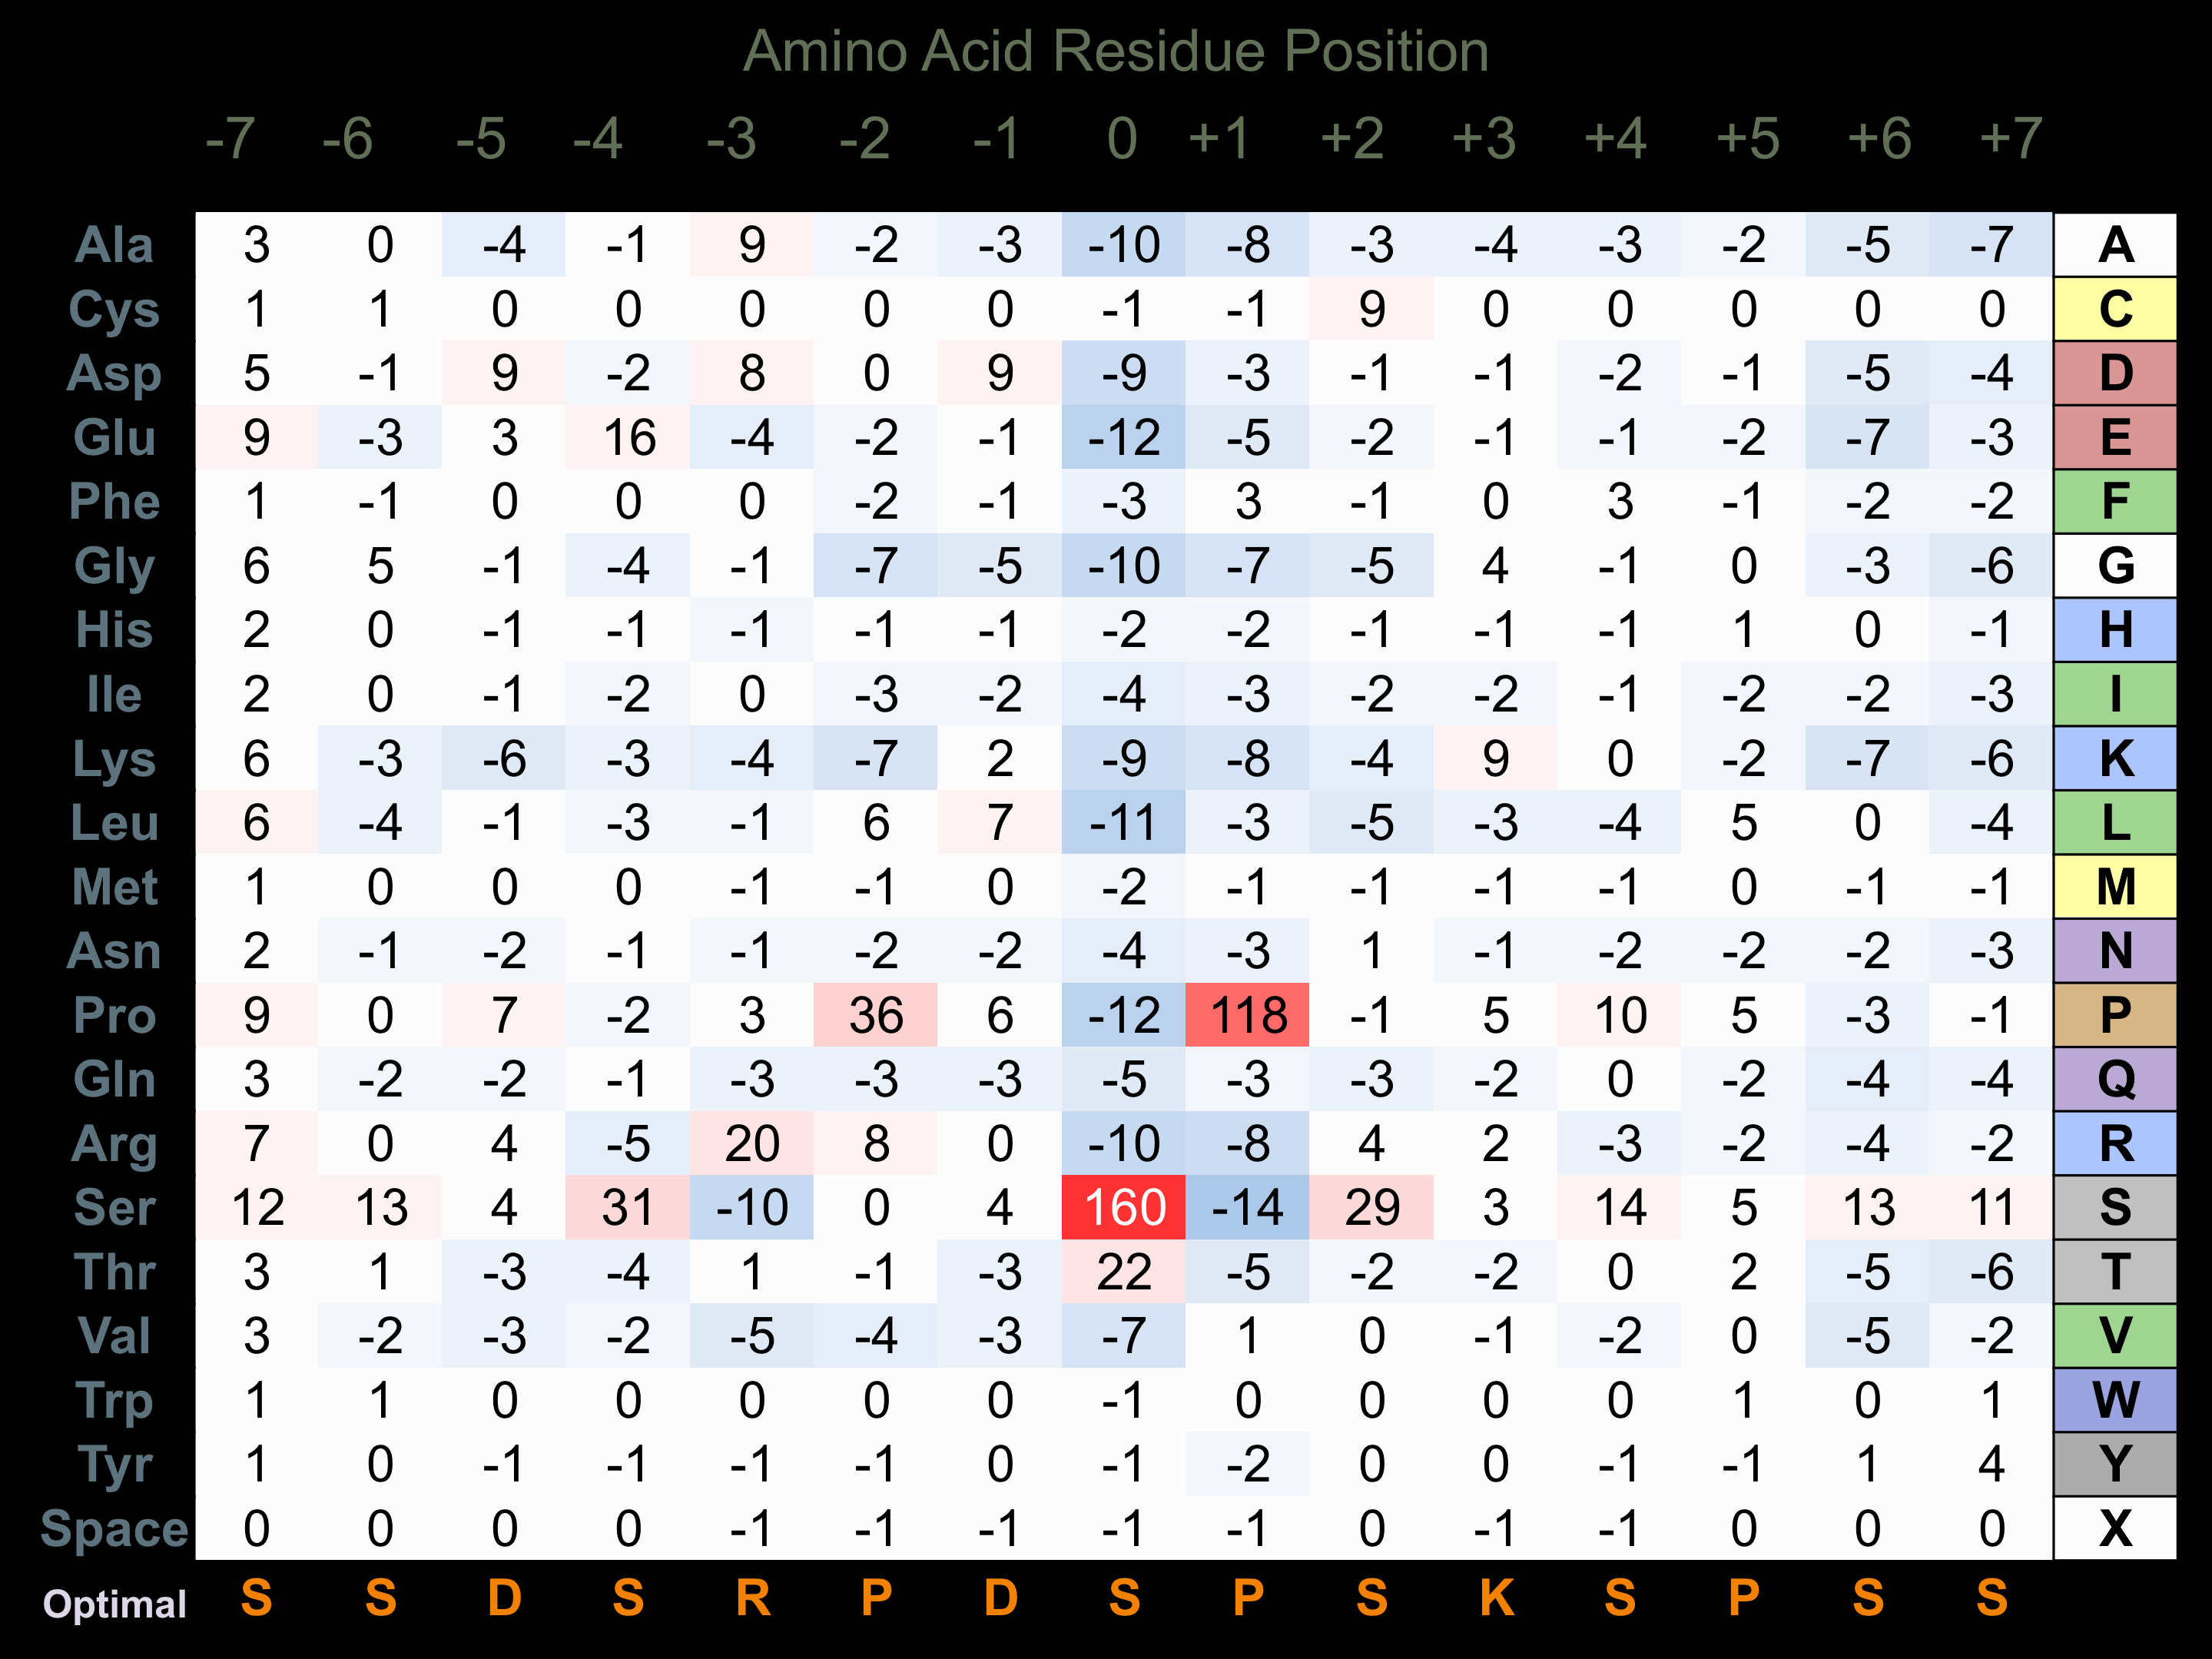
Matrix Type:
Predicted from the application of the Kinexus Kinase Substrate Predictor Version 2.0 algorithm, which was trained with over 10,000 kinase-protein substrate pairs and 8,000 kinase-peptide substrate pairs.
Domain #:
1
Inhibitors
For further details on these inhibitors click on the Compound Name and enter it into DrugKiNET or click on the ID's
Based on in vitro and/or in vivo phosphorylation data
| Compound Name | KD, Ki or IC50 (nM) | PubChem ID | ChEMBL ID | PubMed ID |
|---|
Disease Linkage
General Disease Association:
Cancer
Specific Cancer Types:
Colon cancer
Comments:
Overexpression of NLK is associated with suppressed human colon cancer cell line growth. NLK inhibits human adenosquamous carcinoma cells proliferation and block cell cycle progression to S phase.
Gene Expression in Cancers:
TranscriptoNET (www.transcriptonet.ca) analysis with mRNA expression data retrieved from the National Center for Biotechnology Information's Gene Expression Omnibus (GEO) database, which was normalized against 60 abundantly and commonly found proteins, indicated altered expression for this protein kinase as shown here as the percent change from normal tissue controls (%CFC) as supported with the Student T-test in the following types of human cancers: Bladder carcinomas (%CFC= +68, p<0.005); Clear cell renal cell carcinomas (cRCC) stage I (%CFC= +133, p<0.011); and Large B-cell lymphomas (%CFC= +58, p<0.003).
Mutagenesis Experiments:
Insertional mutagenesis studies in mice have not yet revealed a role for this protein kinase in mouse cancer oncogenesis. A K167N mutation can lead to abrogated phosphotransferase activity.
Mutation Rate in All Cancers:
Percent mutation rates per 100 amino acids length in human cancers: 0.06 % in 24865 diverse cancer specimens. This rate is only -18 % lower than the average rate of 0.075 % calculated for human protein kinases in general.
Mutation Rate in Specific Cancers:
Highest percent mutation rates per 100 amino acids length in human cancers: 0.43 % in 1229 large intestine cancers tested; 0.27 % in 555 stomach cancers tested; 0.22 % in 864 skin cancers tested; 0.16 % in 603 endometrium cancers tested; 0.08 % in 1742 lung cancers tested; 0.08 % in 1512 liver cancers tested; 0.07 % in 548 urinary tract cancers tested; 0.06 % in 942 upper aerodigestive tract cancers tested; 0.05 % in 1253 kidney cancers tested; 0.04 % in 1463 breast cancers tested; 0.03 % in 710 oesophagus cancers tested; 0.02 % in 1982 haematopoietic and lymphoid cancers tested; 0.01 % in 2030 central nervous system cancers tested; 0.01 % in 1445 pancreas cancers tested.
Frequency of Mutated Sites:
None > 5 in 20,654 cancer specimens
Comments:
Only 6 deletions ( five F192fs*30), and no insertions or complex mutations are noted on the COSMIC website.