
Nomenclature
Short Name:
TIF1a
Full Name:
Transcription intermediary factor 1-alpha
Alias:
- HTIF1
- Kinase TIF1-alpha
- Tif1a
- Transcription intermediary factor 1-alpha
- Transcriptional intermediary factor 1 (PTC6,TIF1A)
- Tripartite motif-containing 24
- RNF82
- TIF1
- Tif1
- TIF1A
Classification
Type:
Protein-serine/threonine kinase
Group:
Atypical
Family:
TIF1
SubFamily:
NA

Structure
Mol. Mass (Da):
116,831
# Amino Acids:
1050
# mRNA Isoforms:
2
mRNA Isoforms:
116,831 Da (1050 AA; O15164); 113,018 Da (1016 AA; O15164-2)
4D Structure:
Interacts with CBX1 and CBX3 By similarity. Interacts with NR3C2.
1D Structure:
3D Image (rendered using PV Viewer):
PDB ID
Subfamily Alignment
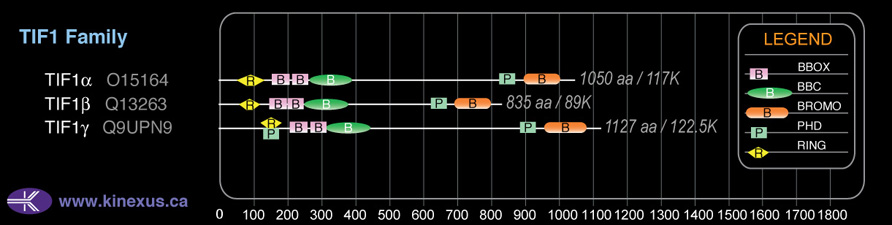
Domain Distribution:
Post-translation Modifications
For detailed information on phosphorylation of this kinase go to PhosphoNET
Methylated:
R469.
Serine phosphorylated:
S110, S153, S154, S209, S452, S590, S606, S654, S660, S663, S664, S667, S685, S687, S696, S744, S748, S762, S768, S771, S797, S808, S811, S874, S1019, S1025, S1028, S1042.
Sumoylated:
K723.
Threonine phosphorylated:
T101, T148, T657, T772, T776, T786, T818.
Tyrosine phosphorylated:
Y234, Y733, Y916, Y936.
Ubiquitinated:
K303, K325, K341, K458.
Distribution
Based on gene microarray analysis from the NCBI
Human Tissue Distribution
% Max Expression:
Mean Expression:
Number of Samples:
Standard Deviation:
% Max Expression:
Mean Expression:
Number of Samples:
Standard Deviation:
 27
27
649
42
823
 2
2
59
20
42
 48
48
1152
21
1586
 31
31
742
138
1409
 31
31
732
33
614
 7
7
172
126
464
 7
7
177
43
336
 74
74
1773
61
3124
 23
23
549
24
484
 8
8
196
119
706
 47
47
1126
46
2284
 33
33
785
229
932
 19
19
449
54
1268
 3
3
75
15
58
 39
39
924
37
1730
 4
4
88
22
87
 12
12
285
141
1051
 35
35
845
32
1326
 13
13
308
129
759
 22
22
525
162
606
 30
30
730
34
1222
 28
28
661
40
1497
 63
63
1520
24
1912
 100
100
2400
32
3457
 46
46
1108
34
2025
 49
49
1174
88
1618
 18
18
426
57
995
 34
34
827
32
1587
 31
31
748
32
1278
 2
2
54
42
45
 25
25
589
30
691
 40
40
954
51
1593
 25
25
592
89
854
 34
34
817
78
672
 71
71
1706
48
2410
Evolution
Species Conservation
PhosphoNET % Identity:
PhosphoNET % Similarity:
Homologene %
Identity:
PhosphoNET % Identity:
PhosphoNET % Similarity:
Homologene %
Identity:
 100
100
100
100 97.8
97.8
98.3
100 99.7
99.7
99.8
100 -
-
-
97 -
-
-
96 56.3
56.3
58.1
97 -
-
-
- 93.6
93.6
96.1
94 27.6
27.6
43.8
90 -
-
-
- 64.7
64.7
70.8
- 73
73
81
82 48.2
48.2
63.6
70 37.6
37.6
54.7
- -
-
-
- -
-
-
- -
-
-
- -
-
-
- -
-
-
- -
-
-
- -
-
-
- -
-
-
- -
-
-
- -
-
-
- -
-
-
-
For a wider analysis go to PhosphoNET Evolution in PhosphoNET
Binding Proteins
Examples of known interacting proteins
hiddentext
| No. | Name – UniProt ID |
|---|---|
| 1 | SYNE1 - Q8NF91 |
| 2 | RAPSN - Q13702 |
| 3 | RNF31 - Q96EP0 |
| 4 | ESR1 - P03372 |
| 5 | CBX5 - P45973 |
| 6 | CBX1 - P83916 |
| 7 | PGR - P06401 |
| 8 | VDR - P11473 |
| 9 | ZNF10 - P21506 |
| 10 | SUMO1 - P63165 |
| 11 | ZNF268 - Q14587 |
| 12 | TRIM28 - Q13263 |
| 13 | TAF7 - Q15545 |
| 14 | PML - P29590 |
| 15 | GTF2E1 - P29083 |
Regulation
Activation:
NA
Inhibition:
NA
Synthesis:
NA
Degradation:
NA
Disease Linkage
General Disease Association:
Cancer, developmental disorders
Specific Diseases (Non-cancerous):
Cerebellar agenesis
Comments:
Cerebellar Agenesis is a rare disorder that has been related to diabetes mellitus, permanent neonatal, with cerebellar agenesis and to the hydrocephalus disorder. Cerebellar Agenesis is characterized by the complete lack of cerebellum causing impaired motor control.
Specific Cancer Types:
Papillary thyroid carcinomas (TPC); Follicular thyroid carcinomas (FTC); 8p11 myeloproliferative syndrome
Comments:
TIF1a is linked to Papillary Thyroid Carcinomas (TPC),which are rare thyroid (endocrine) cancers that affect women more often than men. TPC is characterized by the development of irregular, finger-like extensions of fibrous stroma covered in a layer of neoplastic epithelial cells. Follicular Thyroid Carcinoma (FTC) is another form of thyroid cancer and can affect pituitary and skin tissues in addition to the thyroid. 8p11 Myeloproliferative Syndrome is a rare blood cancer forming either myeloid or lymphoid cell cancer. TIF1A can form an oncogene when it is fused with RET. A D827A mutation in TIF1a resulted in decreased affinity for any histone H3 not methylated at Lys-4. Interaction with histone H3 can be fully inhibited through a C840W mutation. Interaction of TIF1a with H3 histones acylated at Lys-23 is strongly reduced with the F979A + N980A mutations, in conjunction.
Gene Expression in Cancers:
TranscriptoNET (www.transcriptonet.ca) analysis with mRNA expression data retrieved from the National Center for Biotechnology Information's Gene Expression Omnibus (GEO) database, which was normalized against 60 abundantly and commonly found proteins, indicated altered expression for this protein kinase as shown here as the percent change from normal tissue controls (%CFC) as supported with the Student T-test in the following types of human cancers: Bladder carcinomas (%CFC= +169, p<0.004); Brain glioblastomas (%CFC= -64, p<0.0001); Brain oligodendrogliomas (%CFC= -79, p<0.0001); Colon mucosal cell adenomas (%CFC= +62, p<0.0002); Oral squamous cell carcinomas (OSCC) (%CFC= +47, p<0.019); and Ovary adenocarcinomas (%CFC= +109, p<0.006).
Mutagenesis Experiments:
Insertional mutagenesis studies in mice support a role for this protein kinase in mouse cancer oncogenesis. A D827A mutation in TIF1a can result in decreased affinity for any histone H3 not methylated at Lys-4. Interaction with histone H3 can be fully inhibited through a C840W mutation. Interaction of TIF1a with H3 histones acylated at Lys-23 can be strongly reduced with the F979A + N980A mutations, in conjunction.
Mutation Rate in All Cancers:
Percent mutation rates per 100 amino acids length in human cancers: 0.07 % in 25259 diverse cancer specimens. This rate is only -9 % lower and is very similar to the average rate of 0.075 % calculated for human protein kinases in general.
Mutation Rate in Specific Cancers:
Highest percent mutation rates per 100 amino acids length in human cancers: 0.4 % in 1229 large intestine cancers tested; 0.32 % in 895 skin cancers tested; 0.15 % in 589 stomach cancers tested; 0.15 % in 125 biliary tract cancers tested; 0.1 % in 548 urinary tract cancers tested; 0.09 % in 1742 lung cancers tested; 0.08 % in 603 endometrium cancers tested; 0.08 % in 238 bone cancers tested; 0.08 % in 1512 liver cancers tested; 0.07 % in 710 oesophagus cancers tested; 0.06 % in 1463 breast cancers tested; 0.05 % in 1433 kidney cancers tested; 0.04 % in 865 ovary cancers tested; 0.03 % in 881 prostate cancers tested; 0.03 % in 2052 central nervous system cancers tested; 0.03 % in 1445 pancreas cancers tested; 0.02 % in 558 thyroid cancers tested; 0.02 % in 1983 haematopoietic and lymphoid cancers tested.
Frequency of Mutated Sites:
Most frequent mutations with the number of reports indicated in brackets: R721* (6); T577A (4); R910C (4); .
Comments:
Only 6 deletions, 6 insertions, and no complex mutations are noted on the COSMIC website.