
Nomenclature
Short Name:
IRAK2
Full Name:
Interleukin-1 receptor-associated kinase-like 2
Alias:
- IRAK-2
- MGC150550
Classification
Type:
Protein-serine/threonine kinase
Group:
TKL
Family:
IRAK
SubFamily:
NA

Specific Links
Structure
Mol. Mass (Da):
69433
# Amino Acids:
625
# mRNA Isoforms:
1
mRNA Isoforms:
69,433 Da (625 AA; O43187)
4D Structure:
Interacts with MYD88. IL-1 stimulation leads to the formation of a signaling complex which dissociates from the IL-1 receptor following the binding of PELI1.
1D Structure:
3D Image (rendered using PV Viewer):
PDB ID
Subfamily Alignment
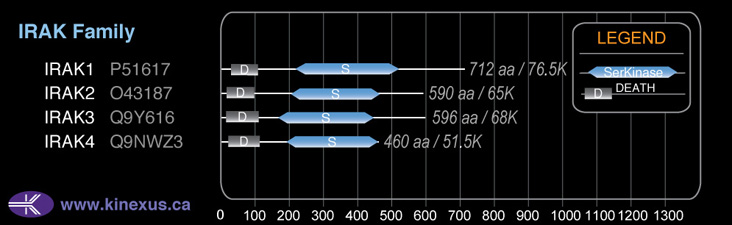
Domain Distribution:
Post-translation Modifications
For detailed information on phosphorylation of this kinase go to PhosphoNET
Acetylated:
K461.
Serine phosphorylated:
S144, S430, S434, S438.
Tyrosine phosphorylated:
Y4, Y6.
Distribution
Based on gene microarray analysis from the NCBI
Human Tissue Distribution
% Max Expression:
Mean Expression:
Number of Samples:
Standard Deviation:
% Max Expression:
Mean Expression:
Number of Samples:
Standard Deviation:
 35
35
1061
21
1106
 0.6
0.6
19
6
26
 4
4
130
11
153
 2
2
48
85
63
 20
20
612
27
326
 0.6
0.6
17
27
16
 0.5
0.5
16
33
19
 1
1
41
14
53
 0.1
0.1
4
3
2
 2
2
65
38
62
 2
2
71
14
115
 19
19
584
43
483
 4
4
127
11
151
 0.07
0.07
2
3
1
 3
3
105
14
169
 0.6
0.6
17
15
20
 2
2
65
26
138
 3
3
85
14
112
 2
2
71
32
39
 19
19
577
77
389
 2
2
55
14
65
 3
3
79
14
111
 3
3
102
11
150
 3
3
103
14
265
 4
4
132
14
224
 20
20
598
64
923
 3
3
102
14
116
 3
3
104
14
155
 3
3
89
14
151
 5
5
155
14
78
 43
43
1312
12
51
 100
100
3049
21
6146
 4
4
128
66
323
 25
25
753
78
668
 7
7
216
48
497
Evolution
Species Conservation
PhosphoNET % Identity:
PhosphoNET % Similarity:
Homologene %
Identity:
PhosphoNET % Identity:
PhosphoNET % Similarity:
Homologene %
Identity:
 100
100
100
100 93.9
93.9
94.4
97 94.5
94.5
96.8
95 -
-
-
79 -
-
-
- 80.3
80.3
86
81 -
-
-
- 69.5
69.5
81.1
70 71.1
71.1
83
71 -
-
-
- 22
22
30
- 40.2
40.2
56.1
50 35.5
35.5
52.2
39 28.7
28.7
50
- -
-
-
- -
-
-
- -
-
-
- -
-
-
- -
-
-
- -
-
-
- -
-
-
- -
-
-
- -
-
-
- -
-
-
- -
-
-
-
For a wider analysis go to PhosphoNET Evolution in PhosphoNET
Binding Proteins
Examples of known interacting proteins
hiddentext
| No. | Name – UniProt ID |
|---|---|
| 1 | IL1R1 - P14778 |
| 2 | TRAF6 - Q9Y4K3 |
| 3 | HRAS - P01112 |
| 4 | TLR4 - O00206 |
| 5 | TIRAP - P58753 |
| 6 | IRAK1 - P51617 |
| 7 | IRAK3 - Q9Y616 |
| 8 | SMAD2 - Q15796 |
| 9 | SMURF1 - Q9HCE7 |
Regulation
Activation:
NA
Inhibition:
NA
Synthesis:
NA
Degradation:
NA
Protein Kinase Specificity
Matrix of observed frequency (%) of amino acids in aligned protein substrate phosphosites
Matrix Type:
Predicted from the application of the Kinexus Kinase Substrate Predictor Version 2.0 algorithm, which was trained with over 10,000 kinase-protein substrate pairs and 8,000 kinase-peptide substrate pairs.
Domain #:
1
Disease Linkage
Mutagenesis Experiments:
Insertional mutagenesis studies in mice have not yet revealed a role for this protein kinase in mouse cancer oncogenesis.
Mutation Rate in All Cancers:
Percent mutation rates per 100 amino acids length in human cancers: 0.08 % in 24433 diverse cancer specimens. This rate is very similar (+ 4% higher) to the average rate of 0.075 % calculated for human protein kinases in general.
Frequency of Mutated Sites:
None > 3 in 20,248 cancer specimens
Comments:
Only 2 deletions, and no insertions or complex mutations are noted on the COSMIC website.