
Nomenclature
Short Name:
BUB1
Full Name:
Mitotic checkpoint serine-threonine-protein kinase BUB1
Alias:
- BUB1A
- BUB1L
- Mitotic checkpoint BUB1
- Budding uninhibited by benzimidazoles 1
- EC 2.7.11.1
- HBUB1
- MBUB1
Classification
Type:
Protein-serine/threonine kinase
Group:
Other
Family:
BUB
SubFamily:
NA

Structure
Mol. Mass (Da):
122,375
# Amino Acids:
1085
# mRNA Isoforms:
3
mRNA Isoforms:
122,375 Da (1085 AA; O43683); 120,002 Da (1065 AA; O43683-3); 115,843 Da (1028 AA; O43683-2)
4D Structure:
Interacts with BUB3 and CASC5. Interacts (when phosphorylated) with PLK1. The BUB1-BUB3 complex interacts with MAD1L1.
1D Structure:
3D Image (rendered using PV Viewer):
PDB ID
Subfamily Alignment
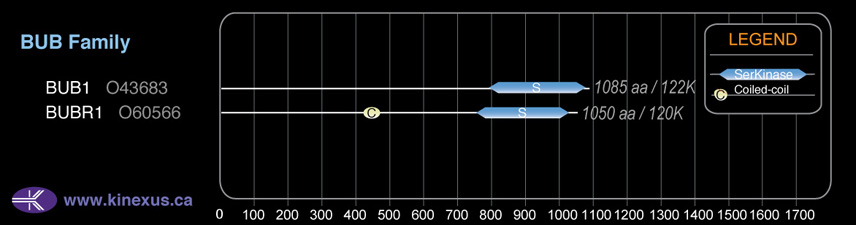
Domain Distribution:
Post-translation Modifications
For detailed information on phosphorylation of this kinase go to PhosphoNET
Acetylated:
K60.
Serine phosphorylated:
S17, S176, S194, S220, S307, S314+, S331, S375, S411, S436, S437, S459, S510, S511, S525, S563, S593, S596, S602, S608, S640, S655, S661, S667, S668, S672, S679, S755, S870, S969.
Threonine phosphorylated:
T378, T435, T440, T441, T444, T452, T461, T479, T589, T601, T609+.
Tyrosine phosphorylated:
Y219, Y538, Y671, Y761, Y869.
Distribution
Based on gene microarray analysis from the NCBI
Human Tissue Distribution
% Max Expression:
Mean Expression:
Number of Samples:
Standard Deviation:
% Max Expression:
Mean Expression:
Number of Samples:
Standard Deviation:
 48
48
958
68
2010
 0.4
0.4
8
29
8
 0.6
0.6
12
5
7
 28
28
548
186
2413
 18
18
357
50
238
 1.2
1.2
23
190
67
 3
3
59
67
196
 100
100
1992
61
5692
 15
15
304
38
223
 0.6
0.6
12
156
21
 0.8
0.8
16
41
19
 31
31
613
327
526
 0.5
0.5
10
60
11
 0.6
0.6
12
20
12
 0.6
0.6
11
26
13
 0.3
0.3
6
35
6
 0.4
0.4
7
138
7
 1
1
20
20
21
 0.6
0.6
12
179
11
 13
13
254
268
299
 0.6
0.6
11
22
17
 0.7
0.7
13
32
12
 0.4
0.4
8
10
6
 3
3
62
20
64
 1.5
1.5
29
22
39
 75
75
1500
104
5318
 2
2
33
63
42
 0.8
0.8
15
19
14
 0.8
0.8
15
20
26
 3
3
64
70
55
 15
15
301
42
465
 45
45
896
81
2303
 20
20
395
122
993
 34
34
682
130
595
 5
5
95
74
132
Evolution
Species Conservation
PhosphoNET % Identity:
PhosphoNET % Similarity:
Homologene %
Identity:
PhosphoNET % Identity:
PhosphoNET % Similarity:
Homologene %
Identity:
 100
100
100
100 99.1
99.1
99.3
99 -
-
-
96 -
-
-
79.5 -
-
-
84 -
-
-
84 -
-
-
- 72
72
82.2
74 -
-
-
74 -
-
-
- -
-
-
- -
-
-
47 -
-
-
49 -
-
-
45 -
-
-
- -
-
-
- -
-
-
- -
-
-
- 26.4
26.4
42.3
- -
-
-
- -
-
-
- -
-
-
- -
-
-
- 20.1
20.1
39.9
- -
-
-
-
For a wider analysis go to PhosphoNET Evolution in PhosphoNET
Binding Proteins
Examples of known interacting proteins
hiddentext
| No. | Name – UniProt ID |
|---|---|
| 1 | BUB3 - O43684 |
| 2 | RAE1 - P78406 |
| 3 | PLK1 - P53350 |
| 4 | EIF4EBP1 - Q13541 |
| 5 | CDC2 - P06493 |
| 6 | APC - P25054 |
| 7 | CDC20 - Q12834 |
| 8 | HDAC1 - Q13547 |
| 9 | AP3B1 - O00203 |
| 10 | AP1B1 - Q10567 |
| 11 | AP2B1 - P63010 |
| 12 | AP4B1 - Q9Y6B7 |
| 13 | ZW10 - O43264 |
| 14 | ARIH2 - O95376 |
| 15 | CRK - P46108 |
Regulation
Activation:
NA
Inhibition:
NA
Synthesis:
NA
Degradation:
Ubiquitinated and degraded during mitotic exit by APC/C-Cdh1.
Known Upstream Kinases
For further details on these substrates click on the Substrate Short Name or UniProt ID. Phosphosite Location is hyperlinked to PhosphoNET
predictions.
Based on in vitro and/or in vivo phosphorylation data
| Kinase Short Name | UniProt ID (Human) | Phosphosite Location | Phosphosite Sequence | Effect of Phosphorylation |
|---|
Known Downstream Substrates
For further details on these substrates click on the Substrate Short Name or UniProt ID. Phosphosite Location is hyperlinked to PhosphoNET
predictions.
Based on in vitro and/or in vivo phosphorylation data
| Substrate Short Name | UniProt ID (Human) | Phosphosite Location | Phosphosite Sequence | Effect of Phosphorylation |
|---|
Protein Kinase Specificity
Matrix of observed frequency (%) of amino acids in aligned protein substrate phosphosites
Matrix Type:
Predicted from the application of the Kinexus Kinase Substrate Predictor Version 2.0 algorithm, which was trained with over 10,000 kinase-protein substrate pairs and 8,000 kinase-peptide substrate pairs.
Domain #:
1
Disease Linkage
General Disease Association:
Cancer
Specific Cancer Types:
Colorectal cancer (CRC); Mosaic variegated aneuploidy syndrome 1; Colorectal cancer with chromosomal instability, somatic
Comments:
BUB1 may be a tumour suppressor protein (TSP). Mosaic Variegated Aneuploidy Syndrome 1 (MVA1), which is a severe developmental disease with characterized mosaic aneuploidies, has an association with the Plk1 and the inactivation of APC/C pathways. Since BUB1 mediates cell death in response to chromosome missegregation and acts to suppress spontaneous tumorigenesis, it behaves like a tumour suppressor protein.
Gene Expression in Cancers:
TranscriptoNET (www.transcriptonet.ca) analysis with mRNA expression data retrieved from the National Center for Biotechnology Information's Gene Expression Omnibus (GEO) database, which was normalized against 60 abundantly and commonly found proteins, indicated altered expression for this protein kinase as shown here as the percent change from normal tissue controls (%CFC) as supported with the Student T-test in the following types of human cancers: Breast sporadic basal-like cancer (BLC) (%CFC= +67, p<0.0001); and Oral squamous cell carcinomas (OSCC) (%CFC= +126, p<0.04). The COSMIC website notes an up-regulated expression score for BUB1 in diverse human cancers of 579, which is 1.3-fold of the average score of 462 for the human protein kinases. The down-regulated expression score of 9 for this protein kinase in human cancers was 0.2-fold of the average score of 60 for the human protein kinases.
Mutagenesis Experiments:
Insertional mutagenesis studies in mice have not yet revealed a role for this protein kinase in mouse cancer oncogenesis. Mutations that prevent interaction with CASC5 include A106D/W, and L122G. Spindle-assembly activity can be partially salvaged with an A130S mutation, but kinetochore localization and binding to CENPF, SGOL1, and BUBR1 are still inhibited. Ubiquitination-mediated loss and CDH1-dependent protein degradation were mediated through K535A, E536A, N537A, K625A, E626A and N627A mutations. Interaction between BUB1 and Plk1 can be reduced with a T609A mutation, and BUB1 activity can be abrogated with a K821A mutation.
Mutation Rate in All Cancers:
Percent mutation rates per 100 amino acids length in human cancers: 0.06 % in 25622 diverse cancer specimens. This rate is only -23 % lower than the average rate of 0.075 % calculated for human protein kinases in general.
Mutation Rate in Specific Cancers:
Highest percent mutation rates per 100 amino acids length in human cancers: 0.34 % in 1093 large intestine cancers tested; 0.23 % in 589 stomach cancers tested; 0.2 % in 602 endometrium cancers tested; 0.16 % in 805 skin cancers tested; 0.1 % in 1942 lung cancers tested.
Frequency of Mutated Sites:
Most frequent mutations with the number of reports indicated in brackets: N534S (3); N534D (3).
Comments:
Only 1 insertion, 1 complex mutation and no deletionsmutations are noted on the COSMIC website.