• KinATLAS
  • TranscriptoNET
  • PhosphoNET
  • OncoNET
  • KinaseNET
  • DrugKiNET
  • DrugProNET
  • KiNET-AM
  • Kinetica Online

Updated November 2019

Home | Kinexus | Contact | Credits

Nomenclature

Short Name:
ROS
Full Name:
Proto-oncogene tyrosine-protein kinase ROS1
Alias:
  • C-ros oncogene 1 , receptor tyrosine kinase
  • C-ros-1
  • ROS1
  • V-ros UR2 sarcoma virus oncogene homolog 1 (avian)
  • V-ros UR2 sarcoma virus oncogene homologue 1 (avian)
  • EC 2.7.10.1
  • KROS
  • MCF3
  • Proto-oncogene tyrosine-protein kinase ROS

Classification

Type:
Protein-tyrosine kinase
Group:
TK
Family:
Sev
SubFamily:
NA


Specific Links

BioCarta Entry: CCR3 pathway
Entrez-Gene Entry: 6098
Entrez-Protein Entry: NP_002935
GeneCards Entry: MCF3
KinBASE Entry: ROS
OMIM Entry: 165020
Pfam Entry: P08922
PhosphoNET Entry: P08922
Phosphosite Plus Entry: 1958
ScanSite Entry: P08922
Source Entry: ROS1
UCSD-Nature Entry: A002093
UniProt Entry: P08922
Kinexus Products: ROS
Orosomucoid 1 receptor-tyrosine kinase; Proto-oncogene tyrosine-protein kinase ROS1 pan-specific antibody AB-NK163-2
Orosomucoid 1 receptor-tyrosine kinase; Proto-oncogene tyrosine-protein kinase ROS1 pan-specific antibody AB-NK163-3
Orosomucoid 1 receptor-tyrosine kinase; Proto-oncogene tyrosine-protein kinase ROS1 pan-specific antibody AB-NK163-4
Orosomucoid 1 receptor-tyrosine kinase; Proto-oncogene tyrosine-protein kinase ROS1 Y2114+Y2115 phosphosite-specific antibody AB-PK803
Orosomucoid 1 receptor-tyrosine kinase / Proto-oncogene tyrosine-protein kinase Ros1 (G42-P56, human) peptide - Powder PE-01AVG99
Orosomucoid 1 receptor-tyrosine kinase / Proto-oncogene tyrosine-protein kinase Ros1 (A1924-P1938, human) peptide - Powder PE-01AVH99
Orosomucoid 1 receptor-tyrosine kinase / Proto-oncogene tyrosine-protein kinase Ros1 (R2205-R2219, human) peptide - Powder PE-01AVI90
Orosomucoid 1 receptor-tyrosine kinase / Proto-oncogene tyrosine-protein kinase Ros1 (N2112-R2118, human) pY2114+pY2115 phosphopeptide - Powder PE-04ADN80
Orosomucoid 1 receptor-tyrosine kinase / Proto-oncogene tyrosine-protein kinase Ros1 (R2108-D2114, human) pY2110 + pY2111 phosphopeptide - Powder PE-04BBF00
Orosomucoid 1 receptor-tyrosine kinase / Proto-oncogene tyrosine-protein kinase Ros1 (K2111-K2117, human) pY2114 phosphopeptide - Powder PE-04BBG00
Orosomucoid 1 receptor-tyrosine kinase / Proto-oncogene tyrosine-protein kinase Ros1 (N2112-R2118, human) pY2114+pY2115 phosphopeptide - Powder PE-04BBH00

General Links

ClustalW2
GPS-Cuckoo
Human Protein Atlas
Kinase.com
Kinase Research
Kinasource
Kinomer
Netphorest
NetworKIN
Phosida
PhosphoElm
Protein Blast
ScanSite
String

Structure

Mol. Mass (Da):
263915
# Amino Acids:
2347
# mRNA Isoforms:
1
mRNA Isoforms:
263,915 Da (2347 AA; P08922)
4D Structure:
NA
1D Structure:
Retrieve Gene Sequence
Retrieve Full Protein Sequence
Retrieve Catalytic Domain Sequence
 
3D Image (rendered using PV Viewer):

PDB ID
3ZBF

Subfamily Alignment
subfamily domain
 
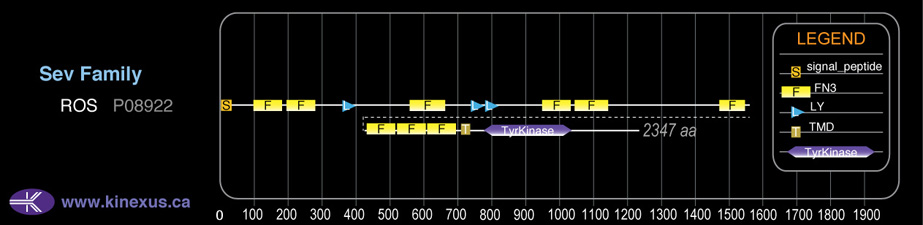
Domain Distribution:
Start End Domain
1 27 signal_peptide
98 188 FN3
194 281 FN3
359 399 LY
558 658 FN3
738 780 LY
781 819 LY
944 1036 FN3
1041 1147 FN3
1450 1548 FN3
1558 1653 FN3
1655 1748 FN3
1749 1851 FN3
1860 1882 TMD
1945 2215 TyrKc
1945 2222 Pkinase
 

Kinexus Products

Click on entries below for direct links to relevant products from Kinexus for this protein kinase.
hiddentext
○ Orosomucoid 1 receptor-tyrosine kinase; Proto-oncogene tyrosine-protein kinase ROS1 pan-specific antibody AB-NK163-2
○ Orosomucoid 1 receptor-tyrosine kinase; Proto-oncogene tyrosine-protein kinase ROS1 pan-specific antibody AB-NK163-3
○ Orosomucoid 1 receptor-tyrosine kinase; Proto-oncogene tyrosine-protein kinase ROS1 pan-specific antibody AB-NK163-4
○ Orosomucoid 1 receptor-tyrosine kinase; Proto-oncogene tyrosine-protein kinase ROS1 Y2114+Y2115 phosphosite-specific antibody AB-PK803
○ Orosomucoid 1 receptor-tyrosine kinase / Proto-oncogene tyrosine-protein kinase Ros1 (G42-P56, human) peptide - Powder PE-01AVG99
○ Orosomucoid 1 receptor-tyrosine kinase / Proto-oncogene tyrosine-protein kinase Ros1 (A1924-P1938, human) peptide - Powder PE-01AVH99
○ Orosomucoid 1 receptor-tyrosine kinase / Proto-oncogene tyrosine-protein kinase Ros1 (R2205-R2219, human) peptide - Powder PE-01AVI90
○ Orosomucoid 1 receptor-tyrosine kinase / Proto-oncogene tyrosine-protein kinase Ros1 (N2112-R2118, human) pY2114+pY2115 phosphopeptide - Powder PE-04ADN80
○ Orosomucoid 1 receptor-tyrosine kinase / Proto-oncogene tyrosine-protein kinase Ros1 (R2108-D2114, human) pY2110 + pY2111 phosphopeptide - Powder PE-04BBF00
○ Orosomucoid 1 receptor-tyrosine kinase / Proto-oncogene tyrosine-protein kinase Ros1 (K2111-K2117, human) pY2114 phosphopeptide - Powder PE-04BBG00
○ Orosomucoid 1 receptor-tyrosine kinase / Proto-oncogene tyrosine-protein kinase Ros1 (N2112-R2118, human) pY2114+pY2115 phosphopeptide - Powder PE-04BBH00
 

Post-translation Modifications

For detailed information on phosphorylation of this kinase go to PhosphoNET
Acetylated:
K1259, K1504, K1749, K1944.
N-GlcNAcylated:
N52, N114, N123, N324, N352, N396, N471, N607, N628, N706, N714, N732, N939, N961, N1015, N1087, N1090, N1095, N1211, N1272, N1330, N1458, N1461, N1474, N1499, N1565, N1669, N1715, N1738, N1808.
Serine phosphorylated:

S818, S1185, S1273, S2002, S2326, S2346.
Threonine phosphorylated:

T143, T145, T188, T196, T1190, T1274, T1375, T1927, T1930, T2338.
Tyrosine phosphorylated:

Y135, Y144, Y800, Y802, Y807, Y1535, Y1923, Y2023, Y2069, Y2110+, Y2114+, Y2115+, Y2173, Y2227, Y2274, Y2323, Y2334, Y2342.
 

Distribution

Based on gene microarray analysis from the NCBI
Human Tissue Distribution
% Max Expression:

Mean Expression:

Number of Samples:

Standard Deviation:
% Max Expression:

Mean Expression:

Number of Samples:

Standard Deviation:
  • adipose
    18

    661

    22

    881

  • adrenal
    0.9

    33

    9

    39

  • bladder
    0.6

    21

    1

    0

  • brain
    27

    960

    82

    2503

  • breast
    9

    331

    24

    272

  • cervix
    2

    55

    52

    144

  • colon
    3

    112

    29

    270

  • heart
    100

    3604

    25

    5452

  • intestine
    7

    254

    10

    253

  • kidney
    1

    54

    69

    63

  • liver
    0.7

    26

    13

    29

  • lung
    16

    582

    100

    618

  • lymphnode
    0.7

    24

    12

    11

  • ovary
    0.8

    27

    8

    22

  • pancreas
    0.5

    18

    9

    19

  • pituitary
    0.3

    11

    13

    9

  • prostate
    3

    93

    105

    873

  • salivarygland
    1

    51

    8

    54

  • skeletalmuscle"
    1

    47

    61

    28

  • skin
    8

    295

    84

    265

  • spinalcord
    0.6

    22

    10

    25

  • spleen
    0.5

    19

    11

    14

  • stomach
    0.9

    32

    10

    24

  • testis
    1

    35

    8

    45

  • thymus
    0.4

    15

    10

    15

  • thyroid
    75

    2717

    52

    4492

  • tonsil
    0.6

    23

    15

    17

  • trachea
    0.7

    25

    7

    27

  • uterus
    0.6

    21

    6

    21

  • reticulocytes"
    4

    132

    28

    91

  • t-lymphocytes
    11

    397

    18

    284

  • b-lymphocytes
    27

    960

    26

    2223

  • neutrophils
    2

    63

    51

    404

  • macrophages
    16

    589

    57

    561

  • sperm
    5

    169

    35

    113


Evolution

Species Conservation
PhosphoNET % Identity:
PhosphoNET % Similarity:
Homologene %
Identity:
PhosphoNET % Identity:
PhosphoNET % Similarity:
Homologene %
Identity:
  • tableheader
    100

    100

    100
  • tableheader
    99.2

    99.5

    99
  • tableheader
    96.6

    98.3

    97
  • tableheader
    -

    -

    85
  • tableheader
    -

    -

    -
  • tableheader
    73.4

    79.8

    84
  • tableheader
    -

    -

    -
  • tableheader
    79.9

    88.3

    80
  • tableheader
    79.8

    87.9

    80.5
  • tableheader
    -

    -

    -
  • tableheader
    33.7

    47.7

    -
  • tableheader
    53.3

    68.7

    55
  • tableheader
    21.1

    34.9

    47
  • tableheader
    -

    -

    45
  • tableheader
    -

    -

    -
  • tableheader
    23.1

    40

    32
  • tableheader
    26.9

    45.5

    -
  • tableheader
    -

    -

    -
  • tableheader
    -

    -

    -
  • tableheader
    -

    -

    -
  • tableheader
    -

    -

    -
  • tableheader
    -

    -

    -
  • tableheader
    -

    -

    -
  • tableheader
    -

    -

    -
  • tableheader
    -

    -

    -
For a wider analysis go to PhosphoNET Evolution in PhosphoNET
 

Binding Proteins

Examples of known interacting proteins
hiddentext
No. Name – UniProt ID
1 PTPN6 - P29350
2 EGFR - P00533
 

Regulation

Activation:
NA
Inhibition:
NA
Synthesis:
NA
Degradation:
NA
 

Kinections Map

Click here to download a PPT of the image below
 
Kinections GIF
 

Protein Kinase Specificity

Matrix of observed frequency (%) of amino acids in aligned protein substrate phosphosites

Kinections GIF
Matrix Type:
Predicted from the application of the Kinexus Kinase Substrate Predictor Version 2.0 algorithm, which was trained with over 10,000 kinase-protein substrate pairs and 8,000 kinase-peptide substrate pairs.
Domain #:
1
 

Inhibitors

For further details on these inhibitors click on the Compound Name and enter it into DrugKiNET or click on the ID's
Based on in vitro and/or in vivo phosphorylation data
Compound Name KD, Ki or IC50 (nM) PubChem ID ChEMBL ID PubMed ID
Staurosporine IC50 = 70 pM 5279 19596575
NVP-TAE684 Kd = 490 pM 16038120 509032 22037378
CHEMBL1684800 IC50 = 1 nM 52938983 1684800 21353571
Crizotinib Kd = 4.1 nM 11626560 601719 22037378
Foretinib Kd = 14 nM 42642645 1230609 22037378
GSK1838705A Kd = 15 nM 25182616 464552 22037378
Cdk1/2 Inhibitor III IC50 < 25 nM 5330812 261720 22037377
Gö6976 IC50 < 25 nM 3501 302449 22037377
K-252a; Nocardiopsis sp. IC50 < 25 nM 3813 281948 22037377
SB218078 IC50 < 25 nM 447446 289422 22037377
Lestaurtinib Kd = 26 nM 126565 22037378
Hesperadin Kd = 77 nM 10142586 514409 19035792
AT9283 IC50 > 100 nM 24905142 19143567
Aloisine A IC50 > 150 nM 5326843 75680 22037377
GSK-3 Inhibitor XIII IC50 > 150 nM 6419766 359482 22037377
IDR E804 IC50 > 150 nM 6419764 1802727 22037377
Ki11502 IC50 > 150 nM 22037377
Pazopanib IC50 > 150 nM 10113978 477772 22037377
Aloisine; RP106 IC50 > 250 nM 44350092 126343 22037377
BCP9000906 IC50 > 250 nM 5494425 21156 22037377
JNJ-7706621 IC50 > 250 nM 5330790 191003 22037377
SU11652 IC50 > 250 nM 24906267 13485 22037377
TWS119 IC50 > 250 nM 9549289 405759 22037377
N-Benzoylstaurosporine Kd = 430 nM 56603681 608533 18183025
Alisertib IC50 < 500 nM 24771867 22016509
Gö6983 IC50 = 500 nM 3499 261491 22037377
TG101348 Kd = 600 nM 16722836 1287853 22037378
Tozasertib Kd = 610 nM 5494449 572878 18183025
Momelotinib IC50 < 750 nM 25062766 19295546
Aurora A Inhibitor 1 (DF) Kd < 800 nM 21992004
Aurora A Inhibitor 23 (DF) Kd < 800 nM 21992004
Aurora A Inhibitor 29 (DF) Kd = 1 µM 21992004
Bisindolylmaleimide I IC50 > 1 µM 2396 7463 22037377
BMS-690514 Kd = 1 µM 11349170 21531814
CHEMBL383899 IC50 > 1 µM 9549303 383899 22037377
H-1152; Glycyl IC50 > 1 µM 16760635 22037377
Icotinib IC50 > 1 µM 22024915 22112293
Indirubin-3′-monoxime IC50 > 1 µM 5326739 22037377
Silmitasertib IC50 > 1 µM 24748573 21174434
SNS314 IC50 > 1 µM 16047143 514582 18678489
SureCN10063060 Ki > 1 µM 52936621 21391610
WHI-P154 IC50 > 1 µM 3795 473773 22037377
WZ3146 Kd > 1 µM 44607360 20033049
WZ4002 Kd > 1 µM 44607530 20033049
AST-487 Kd = 1.7 µM 11409972 574738 18183025
PHA-665752 Kd = 3 µM 10461815 450786 22037378
XMD8-92 IC50 < 3 µM 46843772 1673046 20832753
MLN8054 Kd = 3.1 µM 11712649 259084 18183025
Axitinib Kd = 3.2 µM 6450551 1289926 22037378
Nintedanib Kd = 3.7 µM 9809715 502835 22037378
JNJ-28871063 IC50 > 4 µM 17747413 17975007
 

Disease Linkage

General Disease Association:

Cancer
Specific Cancer Types:
Glioblastoma multiforme (GBM); Non-small cell lung cancer (NSCLC)
Comments:
ROS1 appears to be an oncoprotein (OP). Cancer-related mutations in human tumours point to a gain of function of the protein kinase. The active form of the protein kinase normally acts to promote tumour cell proliferation. ROS is linked to Glioblastoma Multiforme, in which this protein-tyrosine kinase can be constitutively active. This activity can arise either from ROS fusion with the FIG protein or a deletion (q21q21) leading to GOPC-ROS1. Glioblastoma Multiforme is related to astrocytoma and anaplastic astrocytoma, with regions of anaplastic cells surrounding necrotizing tissue. Glioblastoma Multiforme affects brain, endothelial, and bone tissues. Non-small cell lung carcinoma can arise from a SLC34A2-ROS1 fusion expressing the chimeric CD74-ROS1 protein. In non-small cell lung cancer a gain of function has been observed with MLK1 (MAP3K9), activating ERK downstream.
 
Gene Expression in Cancers:

TranscriptoNET (www.transcriptonet.ca) analysis with mRNA expression data retrieved from the National Center for Biotechnology Information's Gene Expression Omnibus (GEO) database, which was normalized against 60 abundantly and commonly found proteins, indicated altered expression for this protein kinase as shown here as the percent change from normal tissue controls (%CFC) as supported with the Student T-test in the following types of human cancers: Uterine leiomyosarcomas (%CFC= +101, p<0.057). The COSMIC website notes an up-regulated expression score for ROS1 in diverse human cancers of 234, which is 0.5-fold of the average score of 462 for the human protein kinases. The down-regulated expression score of 1 for this protein kinase in human cancers was 98% lower than the average score of 60 for the human protein kinases.
Mutagenesis Experiments:

Insertional mutagenesis studies in mice have not yet revealed a role for this protein kinase in mouse cancer oncogenesis. A K1980M mutation can lead to impaired phosphotransferase activity, while the mutations Y2274F or Y2334F can lead to loss of phosphorylation and reduced complex formation with PTPN11.
Mutation Rate in All Cancers:

Percent mutation rates per 100 amino acids length in human cancers: 0.09 % in 25640 diverse cancer specimens. This rate is only 24 % higher than the average rate of 0.075 % calculated for human protein kinases in general.
Mutation Rate in Specific Cancers:

Highest percent mutation rates per 100 amino acids length in human cancers: 0.65 % in 805 skin cancers tested; 0.32 % in 1243 large intestine cancers tested; 0.22 % in 629 stomach cancers tested; 0.17 % in 602 endometrium cancers tested; 0.15 % in 1756 lung cancers tested; 0.13 % in 500 urinary tract cancers tested; 0.07 % in 950 upper aerodigestive tract cancers tested; 0.07 % in 904 ovary cancers tested; 0.07 % in 605 oesophagus cancers tested; 0.06 % in 1466 breast cancers tested; 0.06 % in 1314 kidney cancers tested; 0.04 % in 1962 central nervous system cancers tested; 0.04 % in 1942 haematopoietic and lymphoid cancers tested; 0.04 % in 1270 liver cancers tested.
Frequency of Mutated Sites:

None > 5 in 20,733 cancer specimens
Comments:
Broad distribution of mutation sites with many point mutations, deletions, and insertions noted on the COSMIC website.
 
COSMIC Entry:
ROS1
OMIM Entry:
165020
  • Home
  • Top of Page
Copyright 2019 Kinexus BioInformatics Corporation