
Nomenclature
Short Name:
MAK
Full Name:
Serine-threonine-protein kinase MAK
Alias:
- EC 2.7.11.22
- Male germ cell-associated kinase
Classification
Type:
Protein-serine/threonine kinase
Group:
CMGC
Family:
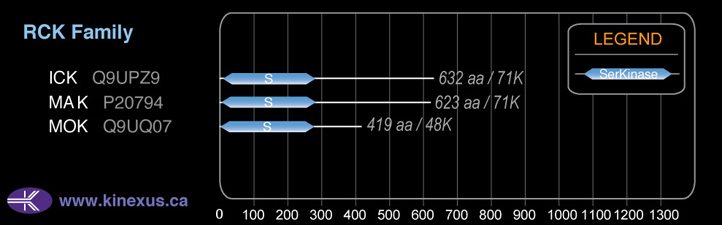
RCK
SubFamily:
NA

Specific Links
Structure
Mol. Mass (Da):
70,581
# Amino Acids:
623
# mRNA Isoforms:
3
mRNA Isoforms:
73,480 Da (648 AA; P20794-2); 70,581 Da (623 AA; P20794); 66,345 Da (583 AA; P20794-3)
4D Structure:
NA
1D Structure:
Subfamily Alignment
Domain Distribution:
| Start | End | Domain |
|---|---|---|
| 4 | 284 | Pkinase |
Kinexus Products
Click on entries below for direct links to relevant products from Kinexus for this protein kinase.
hiddentext
Post-translation Modifications
For detailed information on phosphorylation of this kinase go to PhosphoNET
Serine phosphorylated:
S161, S510.
Threonine phosphorylated:
T157+, T162.
Tyrosine phosphorylated:
Y156+, Y159+, Y480+.
Distribution
Based on gene microarray analysis from the NCBI
Human Tissue Distribution
% Max Expression:
Mean Expression:
Number of Samples:
Standard Deviation:
% Max Expression:
Mean Expression:
Number of Samples:
Standard Deviation:
 97
97
948
22
1379
 0.9
0.9
9
9
9
 2
2
20
13
45
 10
10
100
77
273
 34
34
333
21
230
 0.8
0.8
8
46
8
 0.3
0.3
3
25
3
 21
21
206
29
390
 21
21
203
10
211
 1.1
1.1
11
47
21
 2
2
18
26
35
 52
52
507
94
513
 0.9
0.9
9
24
21
 0.5
0.5
5
6
3
 1.2
1.2
12
23
34
 0.5
0.5
5
12
9
 0.9
0.9
9
108
15
 2
2
17
18
38
 0.8
0.8
8
49
13
 32
32
314
79
294
 1.3
1.3
13
22
26
 2
2
17
24
31
 1.2
1.2
12
14
26
 28
28
278
18
500
 2
2
15
22
31
 40
40
394
50
470
 2
2
16
27
38
 7
7
65
18
110
 1.2
1.2
12
18
20
 4
4
37
14
35
 40
40
397
18
292
 32
32
312
26
409
 6
6
63
29
64
 68
68
663
52
578
 100
100
982
35
1445
Evolution
Species Conservation
PhosphoNET % Identity:
PhosphoNET % Similarity:
Homologene %
Identity:
PhosphoNET % Identity:
PhosphoNET % Similarity:
Homologene %
Identity:
 100
100
100
100 99.2
99.2
99.5
99 97.8
97.8
99.4
98 -
-
-
87 -
-
-
- 91.5
91.5
93.7
92 -
-
-
- 84.1
84.1
90.4
84 85.1
85.1
91.2
85 -
-
-
- 76.2
76.2
85.5
- 72
72
81.5
74 21.8
21.8
33.1
- 59.9
59.9
71.9
62 -
-
-
- -
-
-
- 46.2
46.2
60.5
- -
-
-
- 49.4
49.4
64.4
- -
-
-
- -
-
-
- -
-
-
60 34.8
34.8
50.4
58 -
-
-
- -
-
-
-
For a wider analysis go to PhosphoNET Evolution in PhosphoNET
Regulation
Activation:
NA
Inhibition:
NA
Synthesis:
NA
Degradation:
NA
Protein Kinase Specificity
Matrix of observed frequency (%) of amino acids in aligned protein substrate phosphosites
Matrix Type:
Predicted from the application of the Kinexus Kinase Substrate Predictor Version 2.0 algorithm, which was trained with over 10,000 kinase-protein substrate pairs and 8,000 kinase-peptide substrate pairs.
Domain #:
1
Inhibitors
For further details on these inhibitors click on the Compound Name and enter it into DrugKiNET or click on the ID's
Based on in vitro and/or in vivo phosphorylation data
| Compound Name | KD, Ki or IC50 (nM) | PubChem ID | ChEMBL ID | PubMed ID |
|---|
| R547 | Kd = 11 nM | 6918852 | 22037378 | |
| Alvocidib | Kd = 28 nM | 9910986 | 428690 | 22037378 |
| AT7519 | Kd = 97 nM | 11338033 | 22037378 | |
| PHA-665752 | Kd = 890 nM | 10461815 | 450786 | 22037378 |
| AST-487 | Kd = 1 µM | 11409972 | 574738 | 22037378 |
| WZ3146 | Kd > 1 µM | 44607360 | 20033049 | |
| WZ4002 | Kd > 1 µM | 44607530 | 20033049 | |
| Lestaurtinib | Kd = 1.7 µM | 126565 | 22037378 | |
| Foretinib | Kd = 1.8 µM | 42642645 | 1230609 | 22037378 |
| AC1NS7CD | Kd = 2.3 µM | 5329665 | 295136 | 22037378 |
| SNS032 | Kd = 2.3 µM | 3025986 | 296468 | 22037378 |
| Staurosporine | Kd = 2.6 µM | 5279 | 22037378 |
Disease Linkage
General Disease Association:
Eye disorders
Specific Diseases (Non-cancerous):
MAK-related retinitis pigmentosa; Retinitis pigmentosa 62 (RP62); Leber congenital amaurosis (CRB)
Comments:
MAK-Related Retinitis Pigmentosa is a rare condition characterized by the loss of first rods, then cones in the eye, impairing night vision, then leading to vision impairment. Retinitis Pigmentosa 62 (RP62), like Mak-Related Retinitis Pigmentosa is another rare condition affecting the rods and cones of the eye leading to vision impairment. Leber Congenital Amaurosis (CRB) is a rare condition characterized by vision impairment during early infancy, photophobia, nystagmus (uncontrolled eye movement), far-sightedness, night blindness, abnormal pupil reactivity, and abnormal scaring. CRB affects the retina, but can also affect the eye and testis tissues. The MAK mutations G13S and N130H can independently abrogate kinase phosphotransferase activity. The K33R, T157A, and Y159F mutations will all abrogate autophosphorylation but only the T157A, and Y159F mutations will cause a reduction in kinase phosphotransferase activity.
Comments:
MAK may have a role in prostate cancer chromosome stability and in spermatogenesis.
Gene Expression in Cancers:
The COSMIC website notes an up-regulated expression score for MAK in diverse human cancers of 354, which is 0.8-fold of the average score of 462 for the human protein kinases. The down-regulated expression score of 12 for this protein kinase in human cancers was 0.2-fold of the average score of 60 for the human protein kinases.
Mutagenesis Experiments:
Insertional mutagenesis studies in mice have not yet revealed a role for this protein kinase in mouse cancer oncogenesis.
Mutation Rate in All Cancers:
Percent mutation rates per 100 amino acids length in human cancers: 0.07 % in 24726 diverse cancer specimens. This rate is only -13 % lower than the average rate of 0.075 % calculated for human protein kinases in general.
Mutation Rate in Specific Cancers:
Highest percent mutation rates per 100 amino acids length in human cancers: 0.37 % in 1270 large intestine cancers tested; 0.35 % in 864 skin cancers tested; 0.33 % in 589 stomach cancers tested; 0.27 % in 603 endometrium cancers tested; 0.13 % in 238 bone cancers tested; 0.12 % in 273 cervix cancers tested; 0.07 % in 710 oesophagus cancers tested; 0.06 % in 1512 liver cancers tested; 0.05 % in 881 prostate cancers tested; 0.04 % in 1634 lung cancers tested; 0.04 % in 1316 breast cancers tested; 0.04 % in 1276 kidney cancers tested; 0.03 % in 548 urinary tract cancers tested; 0.02 % in 942 upper aerodigestive tract cancers tested; 0.02 % in 833 ovary cancers tested; 0.01 % in 2009 haematopoietic and lymphoid cancers tested; 0.01 % in 1459 pancreas cancers tested.
Frequency of Mutated Sites:
Most frequent mutations with the number of reports indicated in brackets: R272* (4); R272P (2).
Comments:
Only 1 deletion and 2 insertions and no complex mutations are noted on the COSMIC website.