
Nomenclature
Short Name:
TAF1
Full Name:
Transcription initiation factor TFIID subunit 1
Alias:
- BA2R
- CCG1
- KAT4
- Kinase TAF1
- NSCL2
- Transcription initiation factor TFIID 250 kDa subunit
- CCGS
- Cell cycle gene 1 protein
- DYT3
- DYT3/TAF1
Classification
Type:
Protein-serine/threonine kinase
Group:
Atypical
Family:
TAF1
SubFamily:
NA

Specific Links
Structure
Mol. Mass (Da):
212,677
# Amino Acids:
1872
# mRNA Isoforms:
12
mRNA Isoforms:
216,451 Da (1906 AA; P21675-4); 214,913 Da (1895 AA; P21675-12); 214,714 Da (1893 AA; P21675-2); 212,677 Da (1872 AA; P21675); 208,892 Da (1837 AA; P21675-9); 208,693 Da (1835 AA; P21675-5); 208,364 Da (1832 AA; P21675-3); 205,118 Da (1803 AA; P21675-7); 204,919 Da (1801 AA; P21675-6); 182,054 Da (1592 AA; P21675-8); 175,648 Da (1540 AA; P21675-11); 174,433 Da (1528 AA; P21675-10)
4D Structure:
TAF1 is the largest component of transcription factor TFIID that is composed of TBP and a variety of TBP-associated factors. TAF1, when part of the TFIID complex, interacts with C-terminus of TP53. Component of some MLL1/MLL complex, at least composed of
1D Structure:
3D Image (rendered using PV Viewer):
PDB ID
Subfamily Alignment
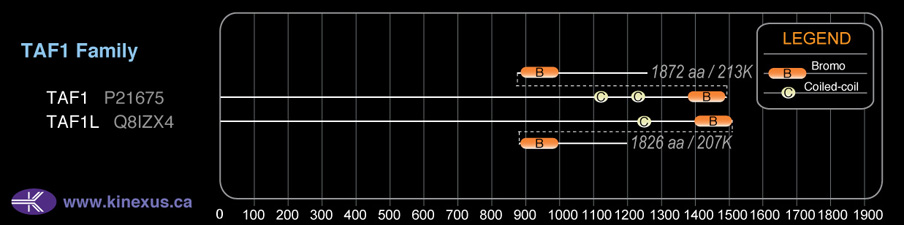
Domain Distribution:
| Start | End | Domain |
|---|---|---|
| 1105 | 1136 | Coiled-coil |
| 1212 | 1245 | Coiled-coil |
| 1397 | 1467 | BROMO |
| 1520 | 1590 | BROMO |
| 1425 | 1872 | pkinase 2 |
| 22 | 87 | TBP binding |
Post-translation Modifications
For detailed information on phosphorylation of this kinase go to PhosphoNET
Acetylated:
K705, K1244, K1347, K1354.
Serine phosphorylated:
S137, S202, S287, S307, S524, S1138, S1152, S1155, S1158, S1340, S1391, S1564, S1633, S1669, S1672, S1678, S1778, S1796, S1799, S1802, S1826.
Threonine phosphorylated:
T198, T442, T855, T1154, T1306, T1360, T1379, T1384, T1643, T1680.
Tyrosine phosphorylated:
Y343, Y350, Y364, Y888, Y889, Y1366, Y1541, Y1562, Y1800, Y1803.
Ubiquitinated:
K701, K705.
Distribution
Based on gene microarray analysis from the NCBI
Human Tissue Distribution
% Max Expression:
Mean Expression:
Number of Samples:
Standard Deviation:
% Max Expression:
Mean Expression:
Number of Samples:
Standard Deviation:
 89
89
1004
35
1011
 7
7
73
19
71
 100
100
1122
39
2167
 43
43
483
153
884
 60
60
672
35
641
 21
21
239
94
799
 23
23
257
49
394
 99
99
1115
79
2017
 29
29
322
17
250
 27
27
306
160
1256
 52
52
589
64
1275
 58
58
653
242
1022
 91
91
1024
61
1687
 6
6
63
18
61
 66
66
743
61
1341
 5
5
53
22
38
 13
13
146
402
811
 73
73
820
50
2200
 24
24
270
144
727
 47
47
529
137
559
 63
63
704
59
2518
 87
87
971
60
2081
 70
70
787
57
1223
 41
41
464
52
700
 89
89
1000
59
2937
 80
80
898
107
1167
 58
58
650
64
1668
 84
84
946
51
3408
 91
91
1023
52
1847
 19
19
210
42
105
 49
49
547
24
524
 57
57
636
41
1221
 21
21
233
83
450
 68
68
768
88
729
 12
12
131
57
120
Evolution
Species Conservation
PhosphoNET % Identity:
PhosphoNET % Similarity:
Homologene %
Identity:
PhosphoNET % Identity:
PhosphoNET % Similarity:
Homologene %
Identity:
 100
100
100
100 0
0
0
84 -
-
-
98 -
-
-
98 -
-
-
98 98
98
99
98 -
-
-
- 94.7
94.7
96.8
96 95.2
95.2
96.8
96 -
-
-
- 30.6
30.6
35.7
- -
-
-
89 -
-
-
87 -
-
-
82 -
-
-
- 45.3
45.3
61.5
56.5 46.7
46.7
61.8
- 30.8
30.8
49.6
44 50
50
64.7
- -
-
-
- -
-
-
- -
-
-
- 20.8
20.8
41.1
30 -
-
-
- -
-
-
-
For a wider analysis go to PhosphoNET Evolution in PhosphoNET
Binding Proteins
Examples of known interacting proteins
hiddentext
| No. | Name – UniProt ID |
|---|---|
| 1 | TAF12 - Q16514 |
| 2 | TAF9 - Q16594 |
| 3 | TAF8 - Q7Z7C8 |
| 4 | TAF6 - P49848 |
| 5 | TAF5 - Q15542 |
| 6 | TAF7 - Q15545 |
| 7 | TAF4 - O00268 |
| 8 | TAF11 - Q15544 |
| 9 | TBP - P20226 |
| 10 | RB1 - P06400 |
| 11 | CCND1 - P24385 |
| 12 | ASF1A - Q9Y294 |
| 13 | FOS - P01100 |
| 14 | UBTF - P17480 |
| 15 | MDM2 - Q00987 |
Regulation
Activation:
NA
Inhibition:
Inhibited by retinoblastoma tumor suppressor protein RB1.
Synthesis:
NA
Degradation:
NA
Known Downstream Substrates
For further details on these substrates click on the Substrate Short Name or UniProt ID. Phosphosite Location is hyperlinked to PhosphoNET
predictions.
Based on in vitro and/or in vivo phosphorylation data
| Substrate Short Name | UniProt ID (Human) | Phosphosite Location | Phosphosite Sequence | Effect of Phosphorylation |
|---|
Disease Linkage
General Disease Association:
Musculoskeletal disorders
Specific Diseases (Non-cancerous):
Dystonia 3, torsion, X-linked; Dystonia; X-linked dystonia-Parkinsonism; Spinocerebellar ataxia Type 17
Comments:
Loss-of-function mutations in the TAF1 gene that decrease the kinase catalytic activity of the protein have been observed in dystonia patients. A 2,627 bp SVA retrotransposon insertion into intron 32 of the TAF1 gene has been hypothesized as the causal mutation responsible for the high frequency of X-linked dystonia-Parkinsonism in a Filippino population on Panay Island. Dystonia is a group of muscle diseases that are characterized by sustained muscle contractions which cause twisting, repetitive movements, or abnormal posture. The movements are involuntary, may be painful, and can affect a single muscle group, a group of muscles (e.g. arm, leg, neck), or all the muscles of the body. Roughly half of the occurence of dystonia is idiopathic and appears to be inherited, referred to as a primary dystonia. X-linked dystonia-Parkinsonism has a well defined pathology consisting of degeneration of the striatum (caudate nucleus and putamen), resembling the pathology of Huntington disease.
Gene Expression in Cancers:
TranscriptoNET (www.transcriptonet.ca) analysis with mRNA expression data retrieved from the National Center for Biotechnology Information's Gene Expression Omnibus (GEO) database, which was normalized against 60 abundantly and commonly found proteins, indicated altered expression for this protein kinase as shown here as the percent change from normal tissue controls (%CFC) as supported with the Student T-test in the following types of human cancers: Brain glioblastomas (%CFC= -66, p<0.064); Brain oligodendrogliomas (%CFC= -90, p<0.019); Cervical cancer stage 2A (%CFC= +98, p<0.036); Clear cell renal cell carcinomas (cRCC) stage I (%CFC= +460, p<0.001); and Ovary adenocarcinomas (%CFC= +51, p<0.019). The COSMIC website notes an up-regulated expression score for TAF1 in diverse human cancers of 591, which is 1.3-fold of the average score of 462 for the human protein kinases. The down-regulated expression score of 192 for this protein kinase in human cancers was 3.2-fold of the average score of 60 for the human protein kinases.
Mutagenesis Experiments:
Insertional mutagenesis studies in mice have not yet revealed a role for this protein kinase in mouse cancer oncogenesis.
Mutation Rate in All Cancers:
Percent mutation rates per 100 amino acids length in human cancers: 0.07 % in 25009 diverse cancer specimens. This rate is the same as the average rate of 0.075 % calculated for human protein kinases in general.
Mutation Rate in Specific Cancers:
Highest percent mutation rates per 100 amino acids length in human cancers: 0.37 % in 603 endometrium cancers tested; 0.26 % in 1372 large intestine cancers tested; 0.19 % in 589 stomach cancers tested; 0.14 % in 864 skin cancers tested; 0.14 % in 1637 lung cancers tested; 0.12 % in 273 cervix cancers tested; 0.11 % in 548 urinary tract cancers tested; 0.1 % in 833 ovary cancers tested; 0.09 % in 1512 liver cancers tested; 0.08 % in 1409 breast cancers tested; 0.07 % in 710 oesophagus cancers tested; 0.05 % in 1276 kidney cancers tested; 0.04 % in 238 bone cancers tested; 0.04 % in 2094 haematopoietic and lymphoid cancers tested; 0.04 % in 2082 central nervous system cancers tested; 0.04 % in 1459 pancreas cancers tested; 0.04 % in 127 biliary tract cancers tested; 0.03 % in 881 prostate cancers tested; 0.02 % in 942 upper aerodigestive tract cancers tested; 0.02 % in 441 autonomic ganglia cancers tested.
Frequency of Mutated Sites:
Most frequent mutations with the number of reports indicated in brackets: R843W (5); R1442Q (4); R1442W (2); E651G (3).
Comments:
Only 6 deletions, 2 insertions, and 3 complex mutations are noted on the COSMIC website.